Throughout last week, the EUR/USD currency pair mainly was declining, which had clear and well-grounded reasons. However, on Friday, there was a sharp collapse of the U.S. dollar, which also had significant justification. Last week was ideal in terms of the market's reaction to events and macroeconomic releases.
It is now essential to analyze and understand what lies ahead for the U.S. dollar. From our point of view, nothing good. In recent weeks (while the dollar was actively rising), we repeatedly said that we were observing only a technical correction on the daily time frame. We also noted that every coin has two sides. The U.S. economy did recover very quickly in Q2 after the change in trade policy, and Donald Trump signed several highly favorable trade agreements with major partners. But on Friday, we saw the other side of the coin. And once it came into view, other indicators started resurfacing—indicators we initially chose to overlook as they seemed less significant.
The NonFarm Payrolls report is not just another labor market release, and the July figures are not just a one-off monthly failure. The data for June and May were revised—not by 10–15K (as is usually the case), but by hundreds of thousands of jobs. As a result, it turned out that just over 100K jobs were created in the past three months—an average of around 30K per month, whereas the "normal" reading is about 200K.
Other reports of the day, such as ISM or the unemployment rate, didn't even need to be considered, because the NonFarm Payrolls report alone showed the real cost of that Q2 GDP growth. And that cost was American jobs. Also, as some experts correctly pointed out, a sharp decline in imports drove the economic growth in Q2. And why did imports fall? Because Trump imposed tariffs against half the world. Even after trade deals began to be signed, the tariffs remained—and in many cases, they were even higher than during the "grace period."
Based on this, imports are bound to shrink significantly compared to 2024. Demand for imported goods and services will simply fall because the prices of cheap or unique foreign goods will force some groups of Americans to give them up. This creates a scenario in which GDP under Trump may show explosive growth quarter after quarter due to low imports. Inflation, meanwhile, will continue rising, and the Fed will be forced to step in to save the labor market. So what does all this mean for the dollar?
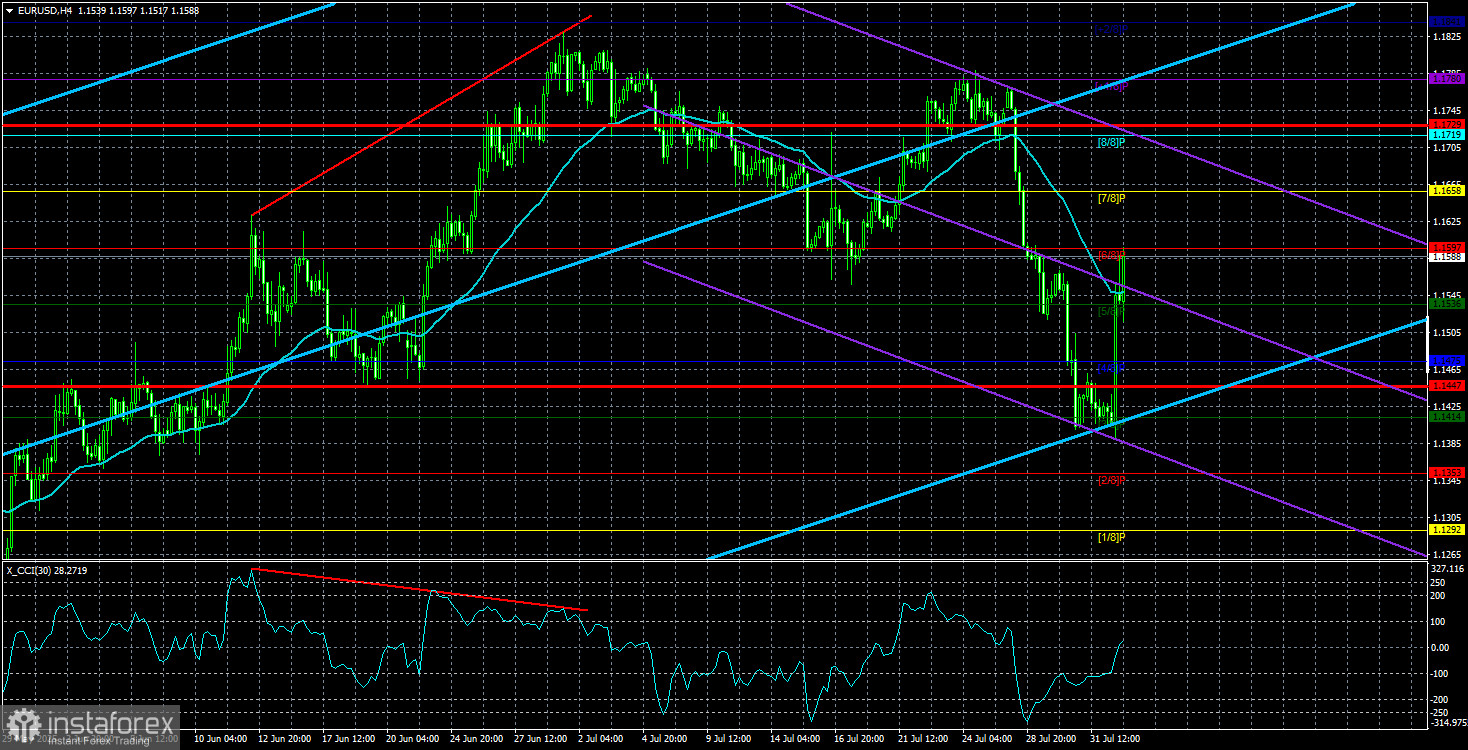
We believe the current fundamental backdrop still suggests a long-term decline in the U.S. currency. In the daily time frame, it's visible that the price has dropped into the Senkou Span B zone, so a resumption of the upward trend that started earlier this year can already be expected.
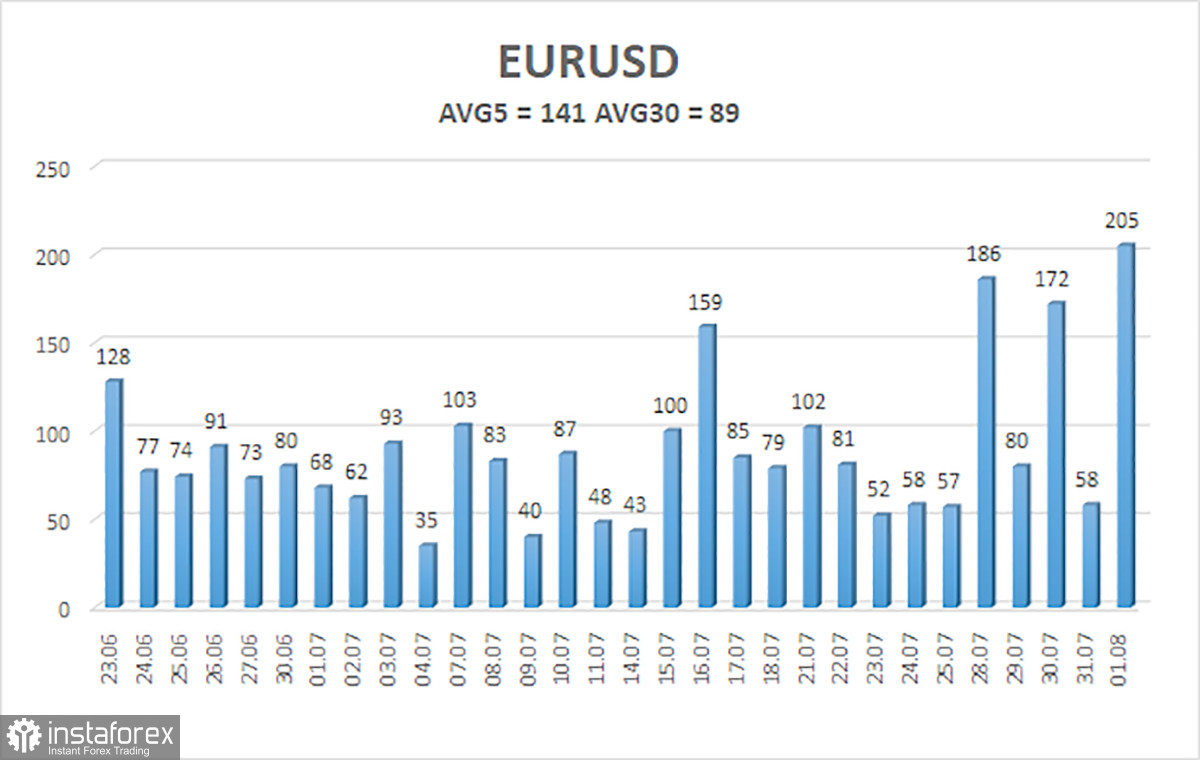
The average volatility of the EUR/USD currency pair over the last five trading days as of August 4 is 141 pips, which is considered "high." We expect the pair to move between the levels of 1.1447 and 1.1729 on Monday. The long-term linear regression channel is directed upward, indicating a continued uptrend. The CCI indicator has entered the oversold zone for the third time, once again warning of a potential trend reversal to the upside.
Nearest Support Levels:
S1 – 1.1536
S2 – 1.1475
S3 – 1.1414
Nearest Resistance Levels:
R1 – 1.1597
R2 – 1.1658
R3 – 1.1719
Trading Recommendations:
The EUR/USD pair may resume its upward trend. Trump's policies continue to have a powerful impact on the U.S. currency. And last week, the world saw the consequences of these policies. The dollar rose as long as it could, but now, it seems, the time has come for a new prolonged decline.
If the price stays below the moving average, small short positions may be considered with targets at 1.1475 and 1.1447. If the price remains above the moving average, long positions with targets at 1.1658 and 1.1719 remain relevant in line with the ongoing trend.
Explanation of Illustrations:
Linear Regression Channels help determine the current trend. If both channels are aligned, it indicates a strong trend.
Moving Average Line (settings: 20,0, smoothed) defines the short-term trend and guides the trading direction.
Murray Levels act as target levels for movements and corrections.
Volatility Levels (red lines) represent the likely price range for the pair over the next 24 hours based on current volatility readings.
CCI Indicator: If it enters the oversold region (below -250) or overbought region (above +250), it signals an impending trend reversal in the opposite direction.