GBP/USD 5-Minute Analysis
On Monday, the GBP/USD currency pair continued to recover after a two-week collapse. Recall that in recent weeks, there were not many factors directly against the British currency, but traders interpreted virtually every piece of news as negative for sterling. At least, that's our view. Either way, the pound lost several hundred points, but the price has now consolidated above the descending trendline. Thus, the downtrend can be considered complete. In this case, the pair's growth will continue in a much more logical and consistent manner.
It is worth noting that this is not so much the pound rising in the FX market as the dollar falling, with all other currencies rising against it. But what difference does it make? The pound had been weakening for 16–17 years straight, and now its "time to shine" has come. A break above 1.3420 and the critical line are additional indirect signs of continued growth this week. However, U.S. data should not be overlooked. While it is extremely difficult to expect strong readings from them right now, forecasts for many indicators are already very low, and surpassing these low forecasts is not particularly challenging.
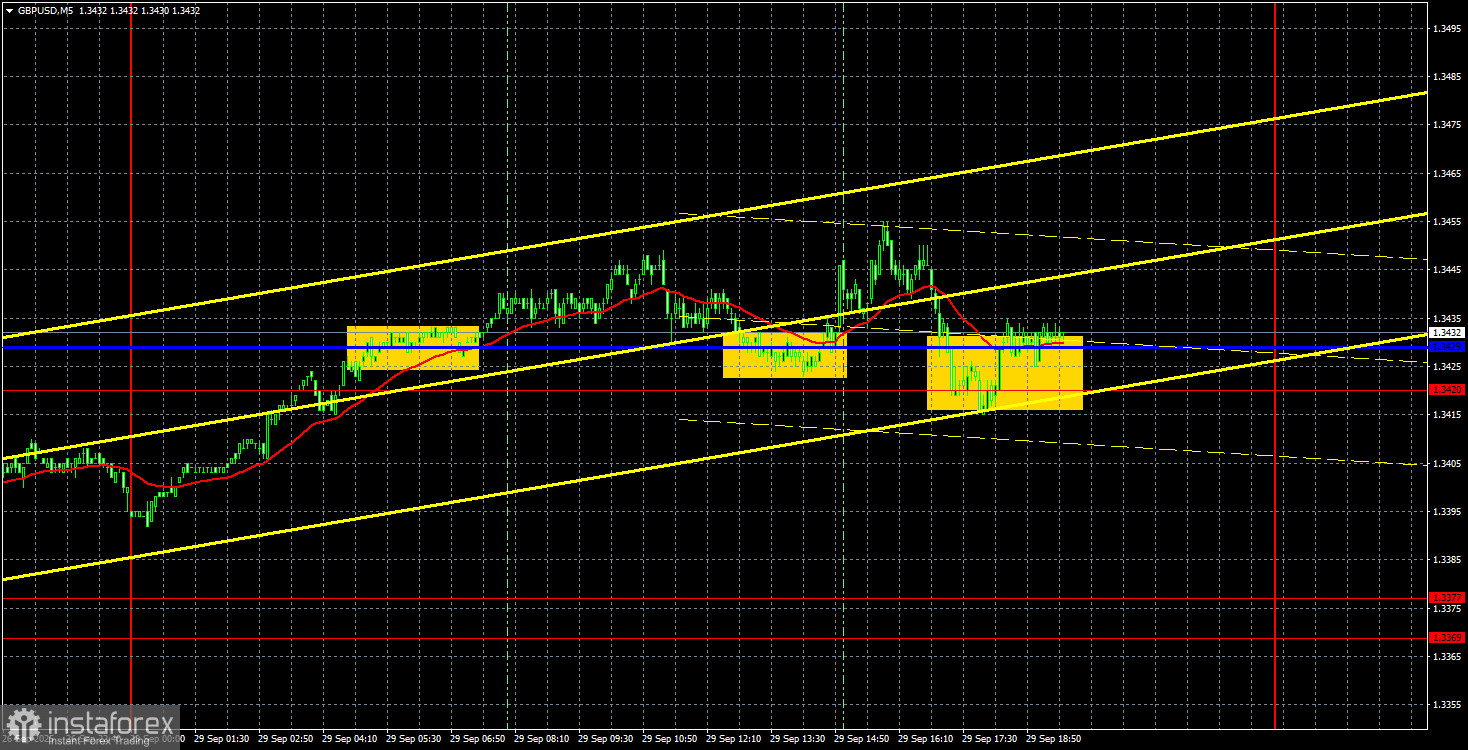
On the 5-minute TF, three buy signals were formed yesterday. First, the pair broke through the 1.3420–1.3429 area, then bounced off it twice from above. If nothing unexpected happens, the northward movement is likely to continue on Tuesday. On Monday, several significant events occurred in either the UK or the U.S. Ahead lie key data on unemployment, the labor market, and ISM business activity, which will inform monetary policy decisions.
COT Report
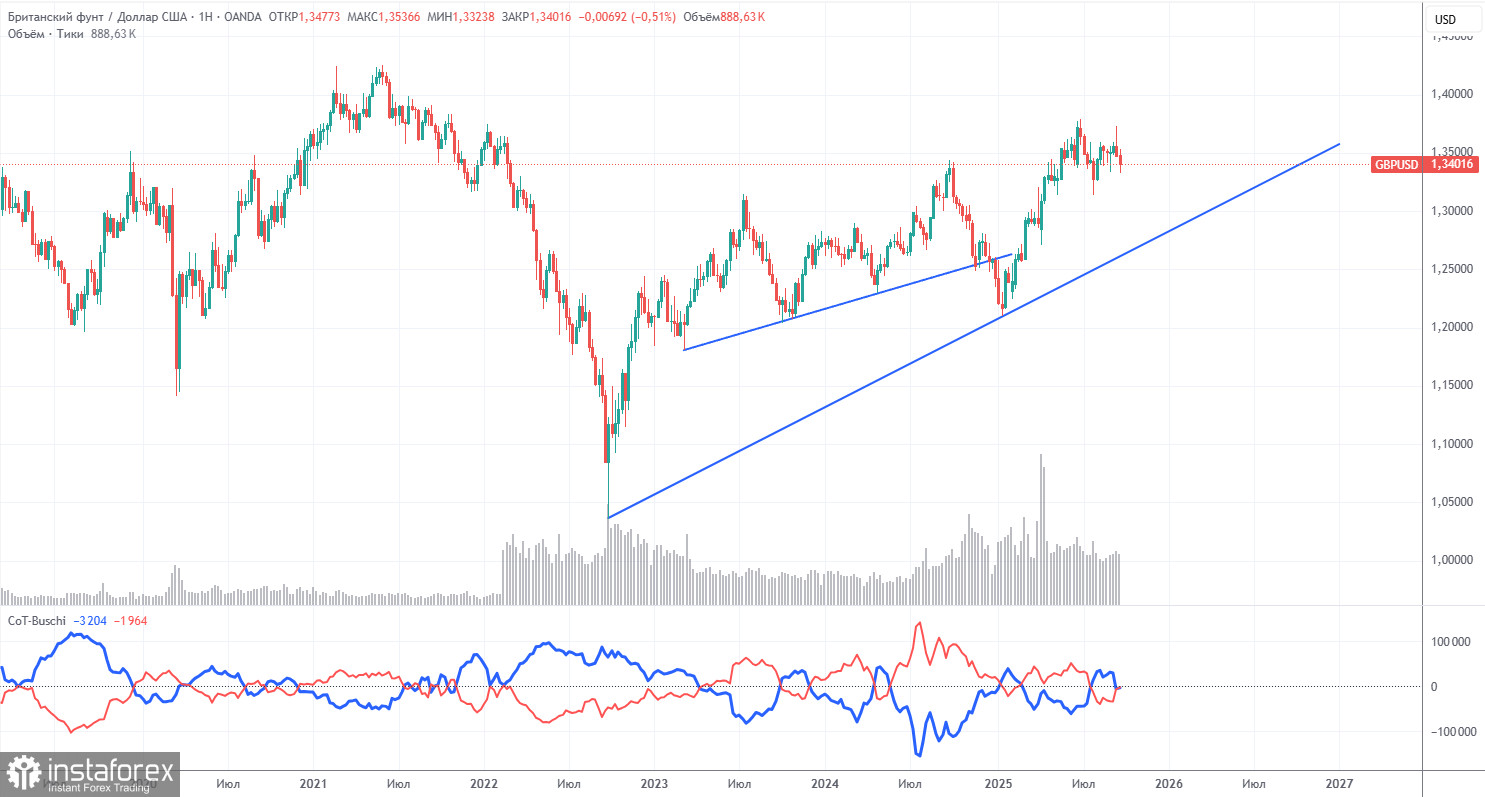
COT reports on the British pound indicate that, in recent years, the sentiment of commercial traders has been constantly shifting. The red and blue lines, representing net positions of commercial and non-commercial traders, frequently intersect and mostly hover near the zero mark. Currently, they are nearly at the same level, indicating roughly equal numbers of long and short positions.
The dollar continues to decline due to Donald Trump's policies, so in principle, market makers' demand for sterling is not especially important right now. The trade war is likely to persist in one form or another for an extended period. The Fed will cut rates in the coming year anyway. Demand for the dollar is expected to continue declining. According to the latest report on the British pound, the "Non-commercial" group opened 3,700 long contracts and closed 900 short contracts. As a result, the net position of non-commercial traders increased by 4,600 contracts over the week.
In 2025, the pound appreciated significantly, and the reason behind this change is clear: the policies of Trump. Once this factor is neutralized, the dollar may shift into growth, but no one knows when that will happen. It doesn't matter how quickly the net position of the pound rises or falls. For the dollar, it is falling anyway, usually at a faster pace.
GBP/USD 1-Hour Analysis
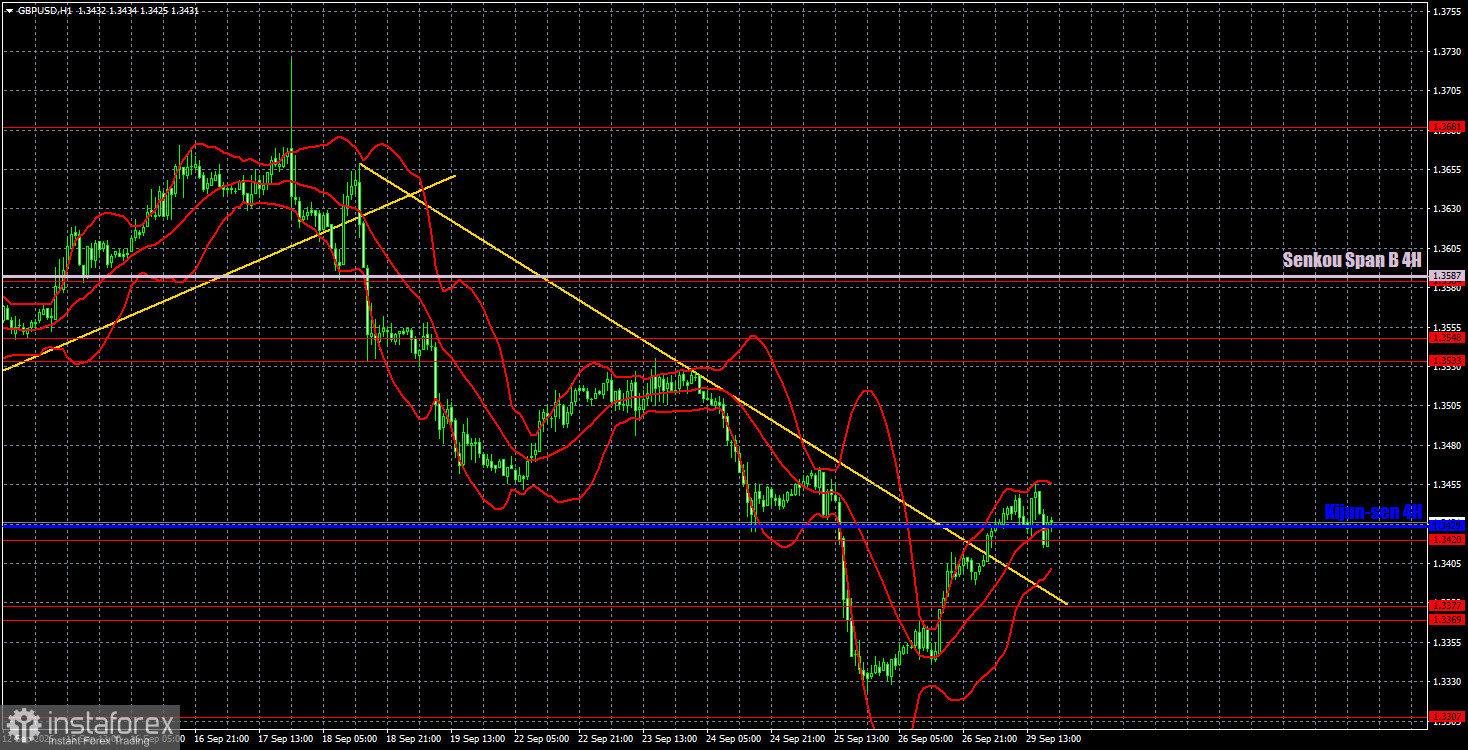
On the hourly TF, GBP/USD shows the same messy picture we've seen in recent weeks. The trendline has been broken, so traders are now justified in expecting further growth. The dollar still lacks global reasons to strengthen, so we anticipate a resumption of the 2025 uptrend in almost any case.
For September 30, we highlight the following important levels: 1.3125, 1.3212, 1.3369–1.3377, 1.3420, 1.3533–1.3548, 1.3584, 1.3681, 1.3763, 1.3833, 1.3886. The Senkou Span B line (1.3587) and the Kijun-sen (1.3429) may also generate signals. A Stop-Loss order is recommended at breakeven once the price moves 20 pips in the desired direction. The Ichimoku indicator lines may shift during the day, which should be considered when identifying trading signals.
On Tuesday, the UK will publish its Q2 GDP in the third estimate. This report usually does not attract much trader interest, but an unexpected reading could change that. In the U.S., the JOLTS job openings report will be released, though this is far from the most important report, given that it is published with a two-month delay.
Trading Recommendations
Today, traders may expect continued growth if the price remains above the 1.3420–1.3429 area. In this case, the target for upward movement will be the 1.3533–1.3548 area. If the price consolidates below the specified area again, then sterling may return to the 1.3369–1.3377 area.
Illustration Explanations:
- Support and resistance price levels – thick red lines where movement may end. They are not trading signal sources.
- Kijun-sen and Senkou Span B lines—These are strong Ichimoku indicator lines transferred to the hourly timeframe from the 4-hour one.
- Extremum levels – thin red lines where the price has previously rebounded. These act as trading signal sources.
- Yellow lines – trend lines, trend channels, and other technical patterns.
- Indicator 1 on the COT charts – the size of the net position for each category of traders.