Analysis of Friday's Trades
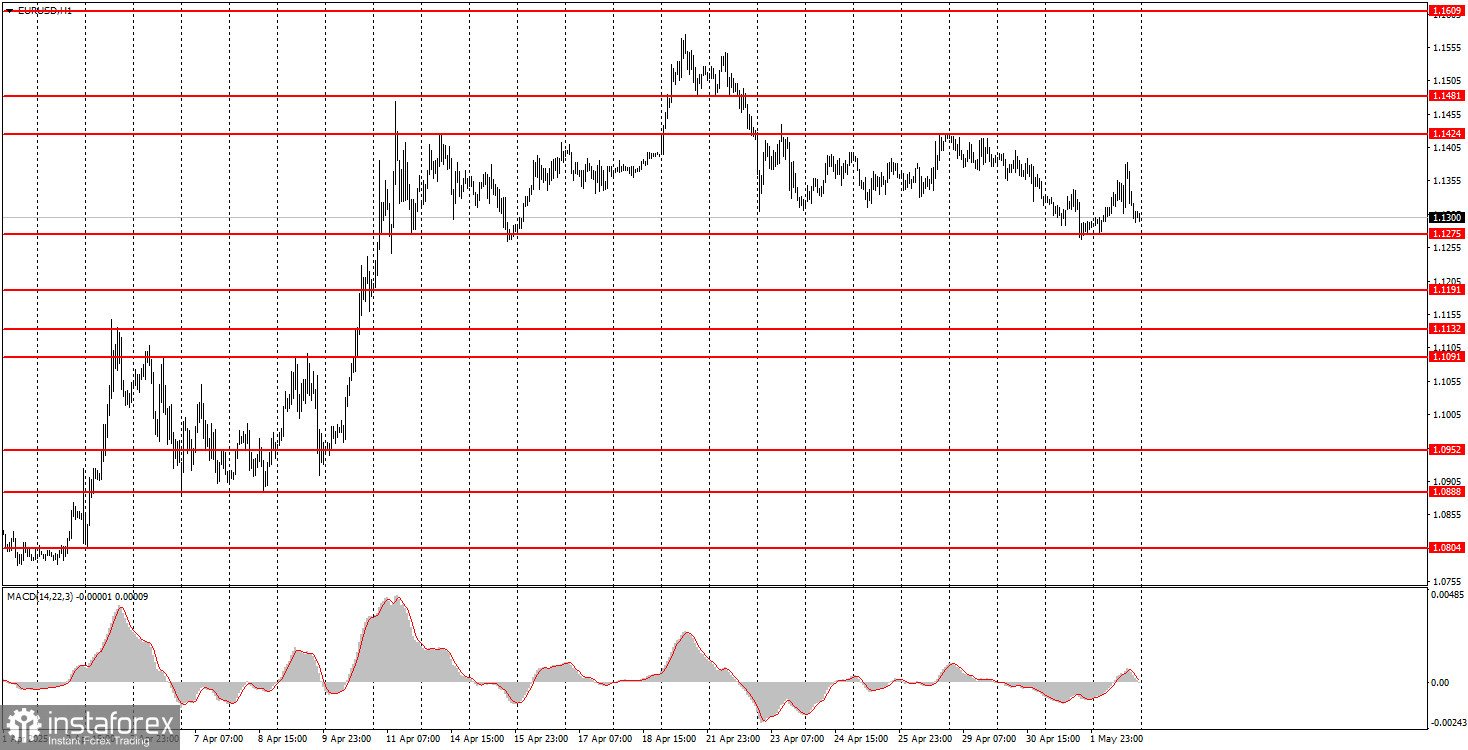
1H Chart of EUR/USD
On Friday, the EUR/USD currency pair continued to trade within the sideways channel between 1.1275 and 1.1424. In principle, there is little to add, as the macroeconomic background was again ignored, and the movements were erratic and chaotic. Nothing changed in the market on Friday. The only notable point is the rebound from the 1.1275 level, which we had previously highlighted. This level marks the lower boundary of the sideways channel, so a bounce from it was expected to trigger an upward movement. However, no strong growth followed, as the U.S. labor market and unemployment data came out better than expected. NonFarm Payrolls for April amounted to 177,000 compared to a forecast of 130,000. The unemployment rate remained unchanged at 4.2%. There was, however, a slight blemish: the March NFP figure was revised down from 228,000 to 185,000. The data package turned out to be neutral, although the dollar had been bracing for worse figures.
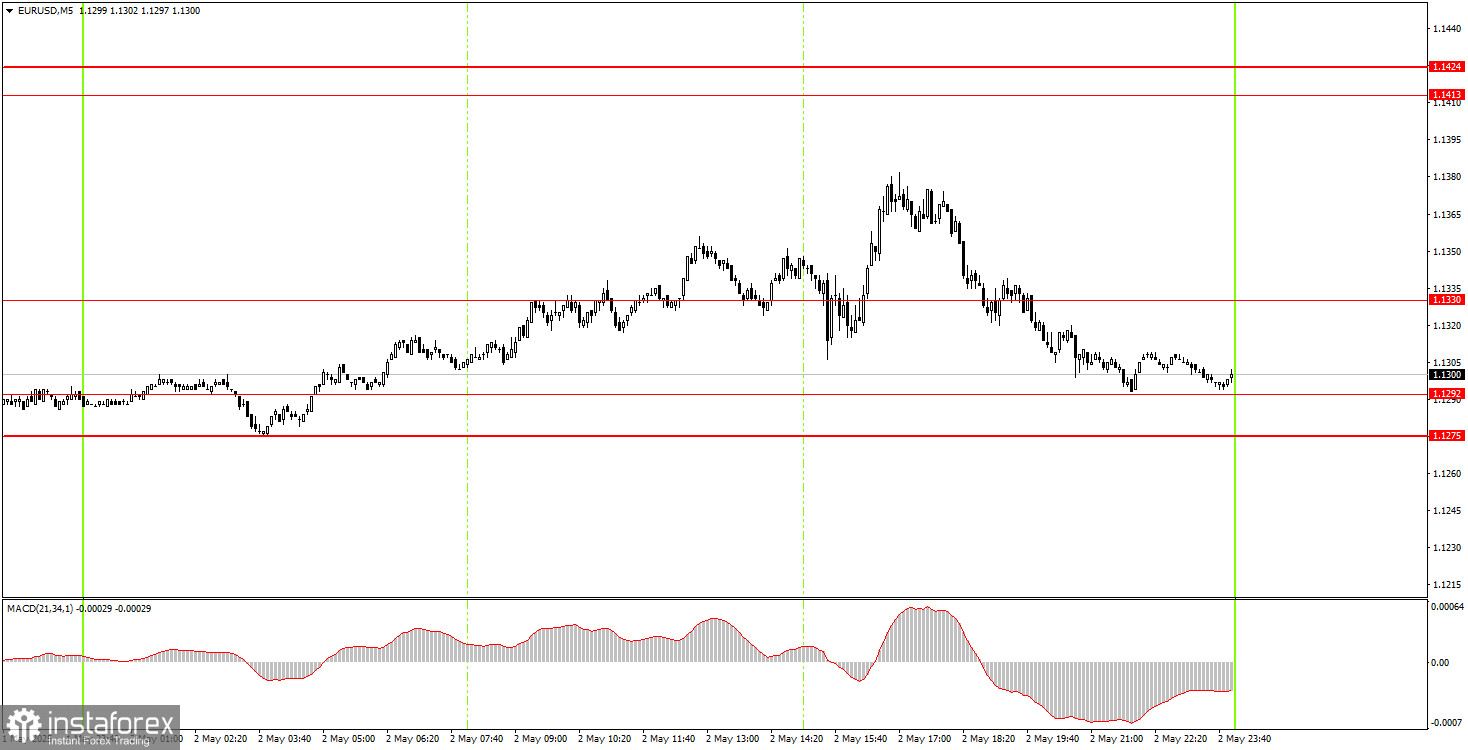
5M Chart of EUR/USD
No valid trading signals were formed on Friday in the 5-minute timeframe. First, the market has remained in a range for over three weeks. Second, price action remains chaotic. Price is not responding to technical levels, and the market ignores macroeconomic data. Therefore, expecting quality signals remains difficult. While isolated trading days may offer entry opportunities, Friday was not one of them.
Trading Strategy for Monday:
The EUR/USD pair maintains a bullish trend on the hourly timeframe. Excluding the movements at the beginning of last week, the market has been in a sideways range near the highs for three weeks. Market sentiment remains extremely negative toward the U.S. dollar and U.S.-related developments. However, if Trump shifts toward de-escalating the trade conflict he initiated, the dollar may regain some strength. When or if that happens remains unknown.
On Monday, the pair could move in either direction again, as all market activity still hinges on Trump's statements and decisions. Since there has been little news from Trump recently, we believe the sideways movement will likely continue. A rebound from the lower boundary of the range (1.1275) could lead to a new upward movement.
On the 5-minute timeframe, the following levels should be monitored: 1.0940–1.0952, 1.1011, 1.1091, 1.1132–1.1140, 1.1189–1.1191, 1.1275–1.1292, 1.1330, 1.1413–1.1424, 1.1474–1.1481, 1.1513, 1.1548, 1.1571, 1.1607–1.1622, 1.1666, 1.1689. No significant events are scheduled in the Eurozone on Monday, and in the U.S., only the ISM Services PMI will be released. As we have already seen, the market barely reacts to macroeconomic data.
Core Trading System Rules:
- Signal Strength: The shorter the time it takes for a signal to form (a rebound or breakout), the stronger the signal.
- False Signals: If two or more trades near a level result in false signals, subsequent signals from that level should be ignored.
- Flat Markets: In flat conditions, pairs may generate many false signals or none at all. It's better to stop trading at the first signs of a flat market.
- Trading Hours: Open trades between the start of the European session and the middle of the US session, then manually close all trades.
- MACD Signals: On the hourly timeframe, trade MACD signals only during periods of good volatility and a clear trend confirmed by trendlines or trend channels.
- Close Levels: If two levels are too close (5–20 pips apart), treat them as a support or resistance zone.
- Stop Loss: Set a Stop Loss to breakeven after the price moves 15 pips in the desired direction.
Key Chart Elements:
Support and Resistance Levels: These are target levels for opening or closing positions and can also serve as points for placing Take Profit orders.
Red Lines: Channels or trendlines indicating the current trend and the preferred direction for trading.
MACD Indicator (14,22,3): A histogram and signal line used as a supplementary source of trading signals.
Important Events and Reports: Found in the economic calendar, these can heavily influence price movements. Exercise caution or exit the market during their release to avoid sharp reversals.
Forex trading beginners should remember that not every trade will be profitable. Developing a clear strategy and practicing proper money management are essential for long-term trading success.