The GBP/USD currency pair continued to trade with a downward bias and weak volatility on Thursday. There was no macroeconomic background that day, and Donald Trump had not yet carried out another military operation. The dollar has been rising steadily, but what is this: the beginning of a new trend with no solid basis, or just another correction?
Many traders believe that Friday will provide clear answers. We do not think so. The Non-Farm Payrolls report and the unemployment rate are, of course, very important, but they are more likely to have a long-term impact on the U.S. dollar. Today, we may see a sharp emotional reaction at the start of the U.S. trading session, but what should we expect from the reports themselves?
We believe that few people expect the unemployment rate to decline or the number of Non-Farm Payrolls to increase to 150–200 thousand in December. Only such figures could be considered clearly positive. At the same time, mediocre results may still be sufficient for growth in the U.S. currency. For example, if the unemployment rate remains unchanged and Non-Farm Payrolls amount to around 80 thousand versus forecasts near 60 thousand. Can such statistics be considered positive? No, because 80 thousand is still a very low figure. Non-Farm Payrolls is not an indicator where any value above zero or above the forecast is automatically positive. However, the market may react to perceived positivity. If the forecast is exceeded, it may be interpreted as positive momentum. Therefore, the dollar may rise even on weak readings in both reports. The key factor is that actual figures come in better than forecasts.
But how will today's reports affect the Federal Reserve's monetary policy plans? We believe that the weaker the December data, the higher the probability of more than one key interest rate cut in 2026. If the labor market is not recovering and is not creating enough jobs, the Fed will have to cut rates. Thus, in the short term, the U.S. currency may strengthen, but in the medium term it is likely to continue declining—especially against the European currency, whose central bank is extremely unlikely to cut rates even once in 2026.
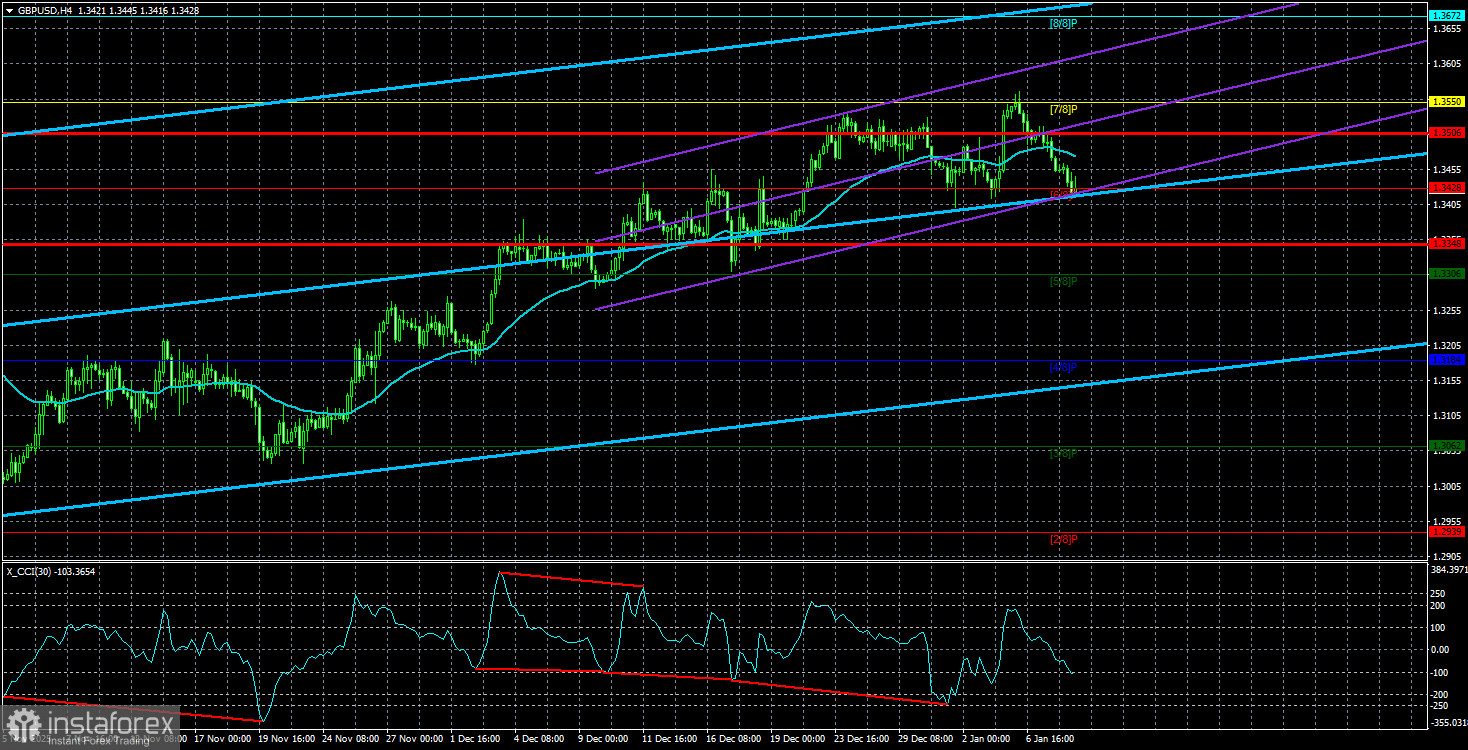
The situation is different against the British pound, as the Bank of England is also continuing to ease policy. However, in our view, even this factor will not protect the dollar from the "Trump factor." If we are wrong about the destructive impact of the Trump factor on the dollar, new signs of a downward trend should appear on the daily timeframe. Meanwhile, the pound recently consolidated above the Kijun-sen and Senkou Span B lines, which opens prospects for an upward trend—more precisely, for a resumption of the 2025 uptrend. We remain highly skeptical about any growth in the dollar, but we are ready to respond to any changes in the fundamental background and market conditions.
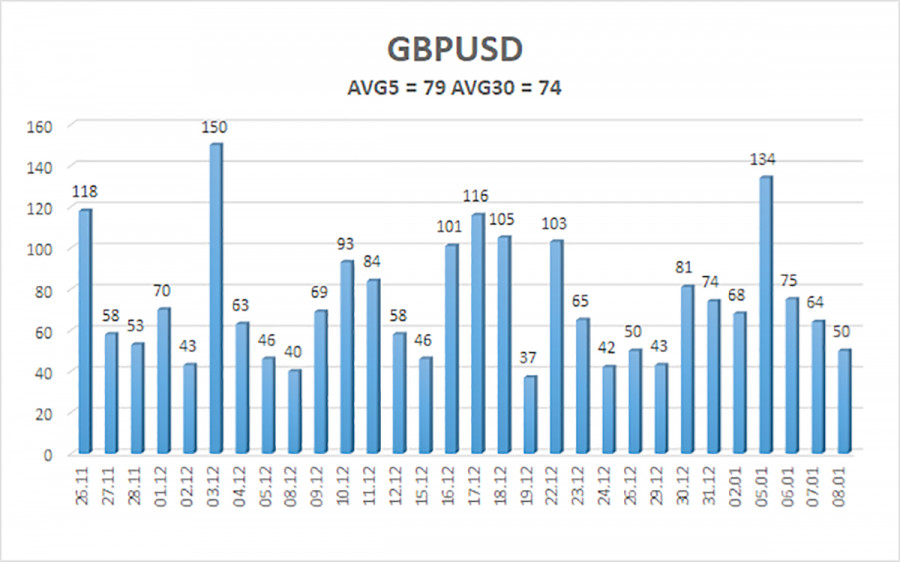
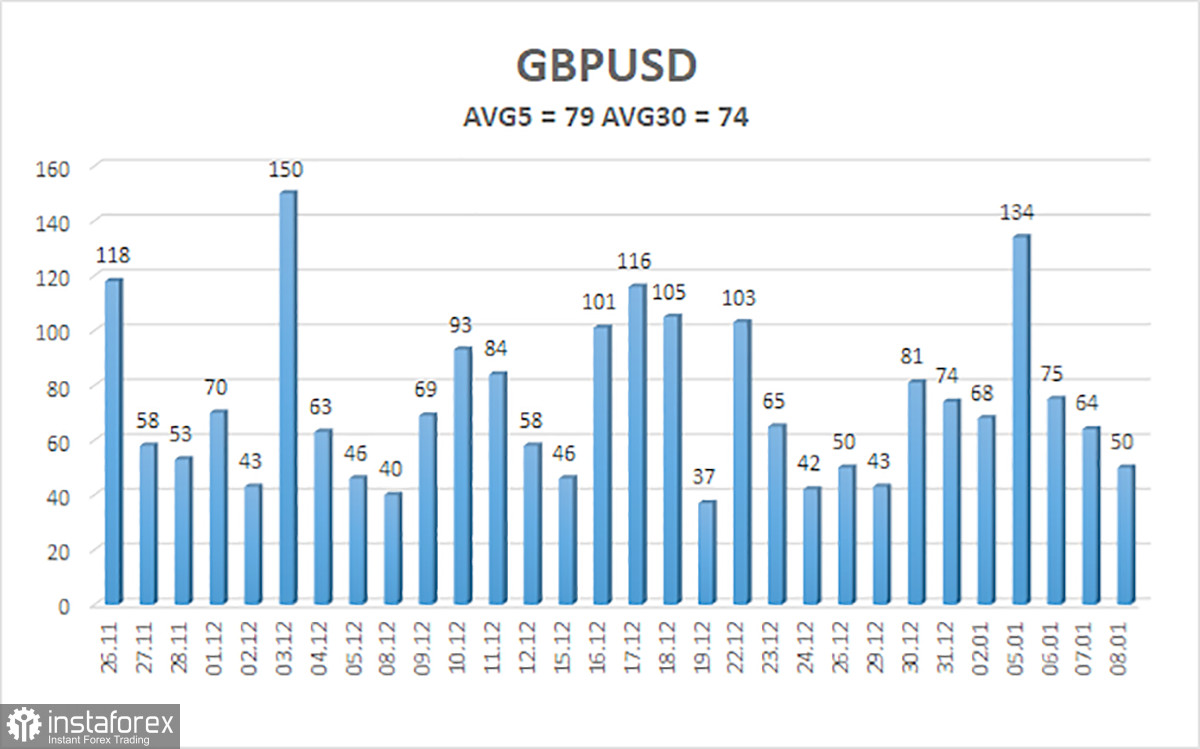
The average volatility of the GBP/USD pair over the past five trading days is 79 points, which is considered "average" for the pound/dollar pair. Thus, on Friday, January 9, we expect price movement within a range bounded by 1.3348 and 1.3506. The higher linear regression channel has turned upward, indicating a recovery of the trend. The CCI indicator has entered the oversold zone six times in recent months and has formed multiple bullish divergences, repeatedly warning traders of the continuation of the upward trend.
Nearest support levels:
- S1 – 1.3428
- S2 – 1.3306
- S3 – 1.3184
Nearest resistance levels:
- R1 – 1.3550
- R2 – 1.3672
- R3 – 1.3794
Trading Recommendations
The GBP/USD currency pair is attempting to resume the 2025 upward trend, and its long-term outlook remains unchanged. Donald Trump's policies will continue to put pressure on the U.S. economy, so we do not expect growth in the U.S. currency. Therefore, long positions with targets at 1.3550 and 1.3672 remain relevant in the near term while the price stays above the moving average. If the price is below the moving average, small short positions may be considered on technical grounds with a target of 1.3348.
From time to time, the U.S. currency shows corrections on a global scale, but for trend-based strengthening it needs signs of an end to the trade war or other global positive factors.
Explanations to the Illustrations
- Linear regression channels help determine the current trend. If both are directed in the same direction, the trend is considered strong.
- Moving average line (settings: 20.0, smoothed) determines the short-term trend and the direction in which trading should currently be conducted.Murray levels are target levels for price movements and corrections.
- Volatility levels (red lines) represent the likely price channel in which the pair will trade over the next 24 hours, based on current volatility readings.
- CCI indicator – entering the oversold zone (below ?250) or the overbought zone (above +250) indicates that a trend reversal in the opposite direction may be approaching.