On Friday, the GBP/USD currency pair posted a slight increase, though volatility remained nearly minimal. The U.S. was expected to release the Non-Farm Payrolls and unemployment data that day, but it had become clear earlier in the week that those reports wouldn't be published due to the ongoing government shutdown, which forced many federal agencies into unpaid leave.
However, the ISM Services PMI was released on Friday, and it sharply disappointed, following the same pattern seen earlier with the Manufacturing PMI. Thus, the dollar had significant reasons to fall, yet once again it barely moved, despite ample justification for a decline.
As we have stated multiple times, the recent market behavior in the pair is fundamentally illogical. This is most evident on the daily timeframe: initially, a technical correction followed a strong upward trend, which made sense. But now, for nearly two months, the market has barely moved—an extended flat. Fundamentally, the backdrop for the dollar hasn't only failed to improve—it has deteriorated weekly.
To recap: the U.S. labor market has weakened, business activity indexes have dropped, inflation is rising, the Federal Reserve remains on a dovish path, Donald Trump has imposed tariffs on sectors including film, pharmaceuticals, trucks, and furniture, and a government shutdown has begun. If the pound were trading above $1.40, everything would make perfect sense.
It's also worth noting: there's no need to search for a black cat in a dark room—especially when it isn't there. Many analysts scramble to explain the dollar's apparent resilience by citing so-called "bullish" factors, while overlooking dozens of bearish ones. For example, last week, some Fed officials stated their support only for moderate rate cuts. But what's so unexpected—or bullish—about that?
Let us remind you: Fed officials have never supported aggressive rate cuts, not even when the labor market showed obvious signs of strain caused by the policies of Trump. Earlier this year, Chairman Powell and colleagues mentioned a maximum of two cuts in 2025. Now, Powell is floating the possibility of three. This signals a more dovish—not hawkish—stance.
The fact that most FOMC members don't support aggressive easing doesn't mean they don't support easing at all. For the dollar, any level of easing from the Fed is inherently bearish—especially since the ECB has finished its own rate-cutting cycle, and the Bank of England is on a prolonged pause due to high inflation. Thus, even two rate cuts by year's end reflect a dovish Fed outlook that should further pressure the greenback.
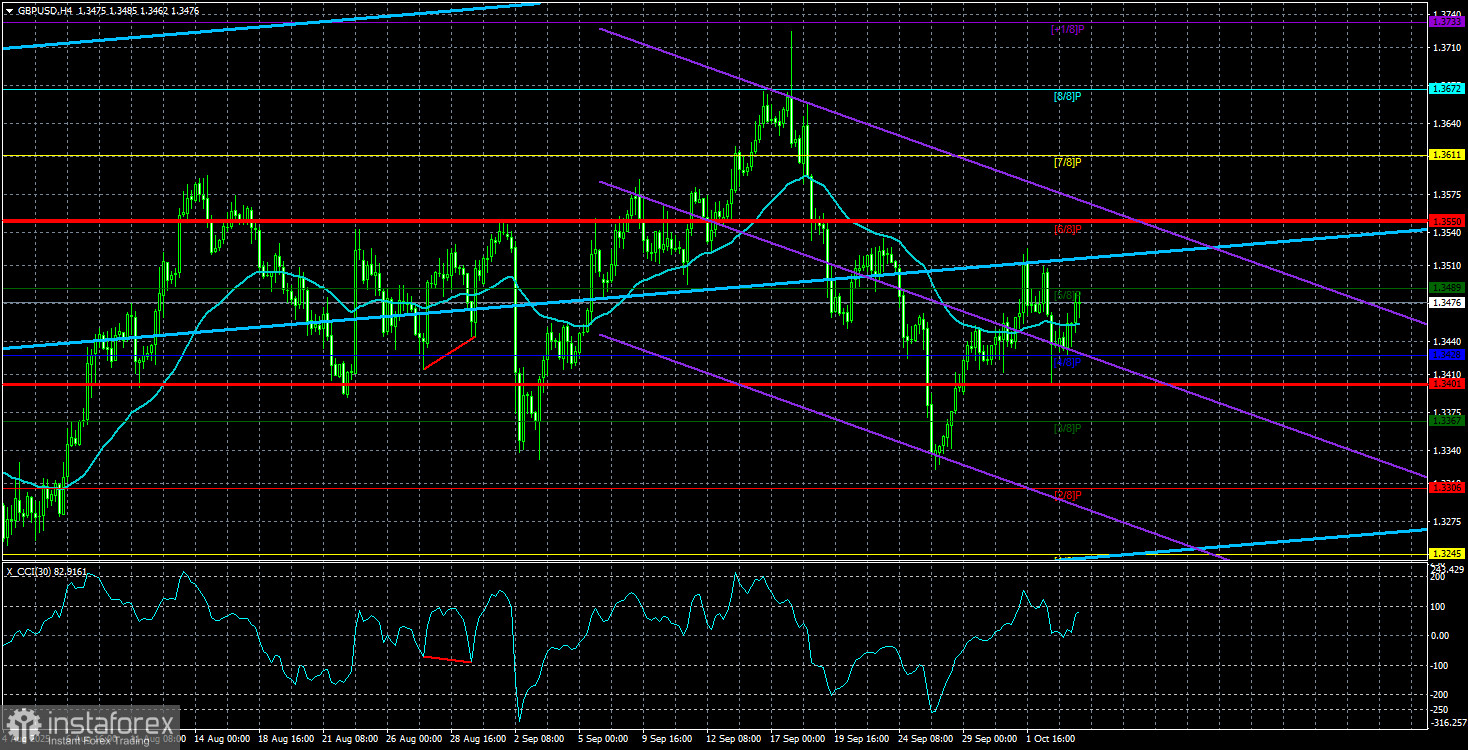
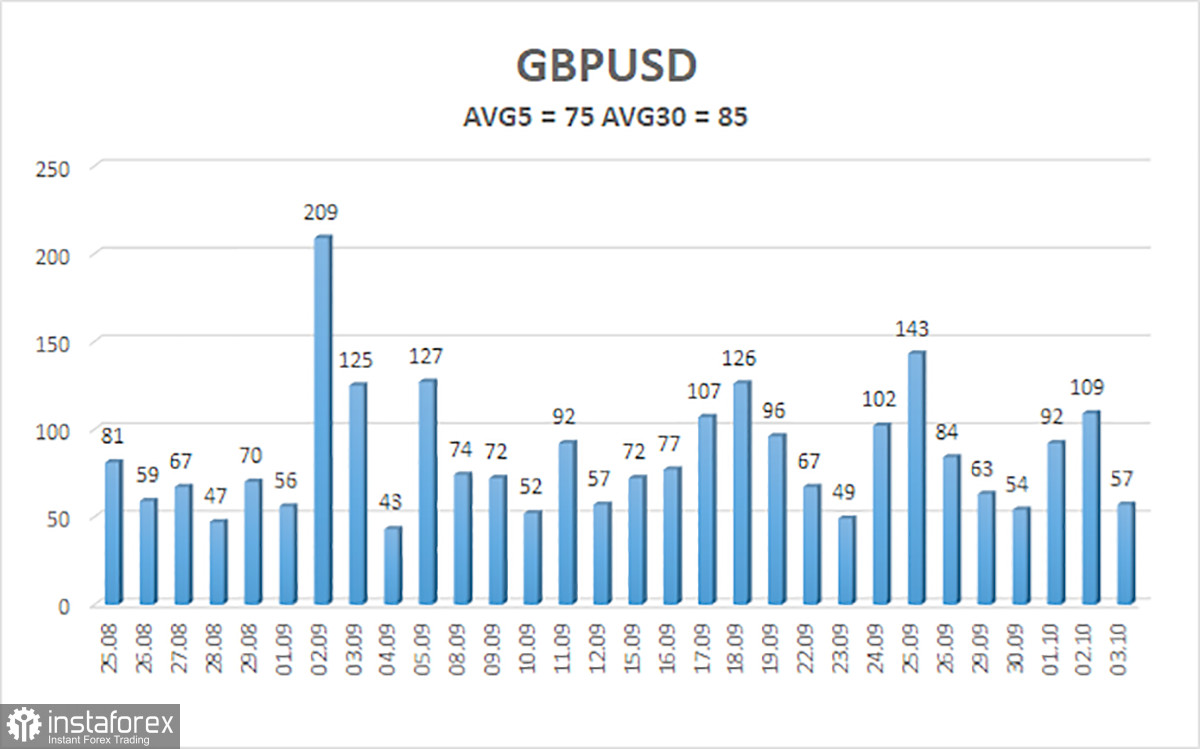
The average volatility of the GBP/USD pair over the last five trading days is 75 pips—considered "average" for this pair. On Monday, October 6, we expect the price to remain within the 1.3401–1.3551 range. The higher linear regression channel is pointed upwards, indicating a clear bullish trend. Meanwhile, the CCI indicator dipped into oversold territory, signaling a potential resumption of the uptrend.
Key Support Levels:
- S1: 1.3428
- S2: 1.3367
- S3: 1.3306
Key Resistance Levels:
- R1: 1.3489
- R2: 1.3550
- R3: 1.3611
Trading Recommendations
GBP/USD is currently correcting, but its long-term outlook remains unchanged. Trump's policies continue to pressure the dollar, so we don't expect sustainable growth from the U.S. currency.
Thus, long positions remain preferred, targeting 1.3672 and 1.3733, as long as the pair trades above the moving average. If the price drops below the moving average, short-term shorts may be considered with targets at 1.3401 and 1.3367 based on technical signals alone.
From time to time, the dollar experiences corrective bounces (as is the case now), but for an actual trend reversal, it would require strong, positive triggers, such as the end of the trade war or other global tailwinds.
Chart Legend:
- Linear Regression Channels help define the current trend. If both channels point in the same direction, the trend is strong.
- The Moving Average (20.0, smoothed) defines the short-term direction and trade bias.
- Murray Levels serve as key support/resistance targets for trend continuation or corrections.
- Volatility Levels (red lines) indicate the likely price range for the trading day based on recent volatility.
- The CCI Indicator entering overbought (above +250) or oversold (below -250) territory signals potential trend reversal.