Monday's Trade Breakdown
1-Hour EUR/USD Chart
On Monday, the EUR/USD currency pair continued to slide lower, despite breaking the descending trendline three times. Thus, we still believe that the local downtrend has come to an end. However, the price has failed to break above the 1.1754 level after six attempts.
In our opinion, the US dollar still has no foundation for a medium-term rally, so we expect the upward movement in EUR/USD to resume in any case. The only question is — when?
Currently, the market shows little interest in opening long positions, despite all necessary conditions being present. Monday's session didn't clarify much. From the start of the day, the euro declined due to a new political crisis erupting in France. However, we don't expect that event to have a prolonged impact on the euro, as France now sees political crises almost monthly, with another prime minister stepping down. Christine Lagarde's speech did not provide any new information to the market.
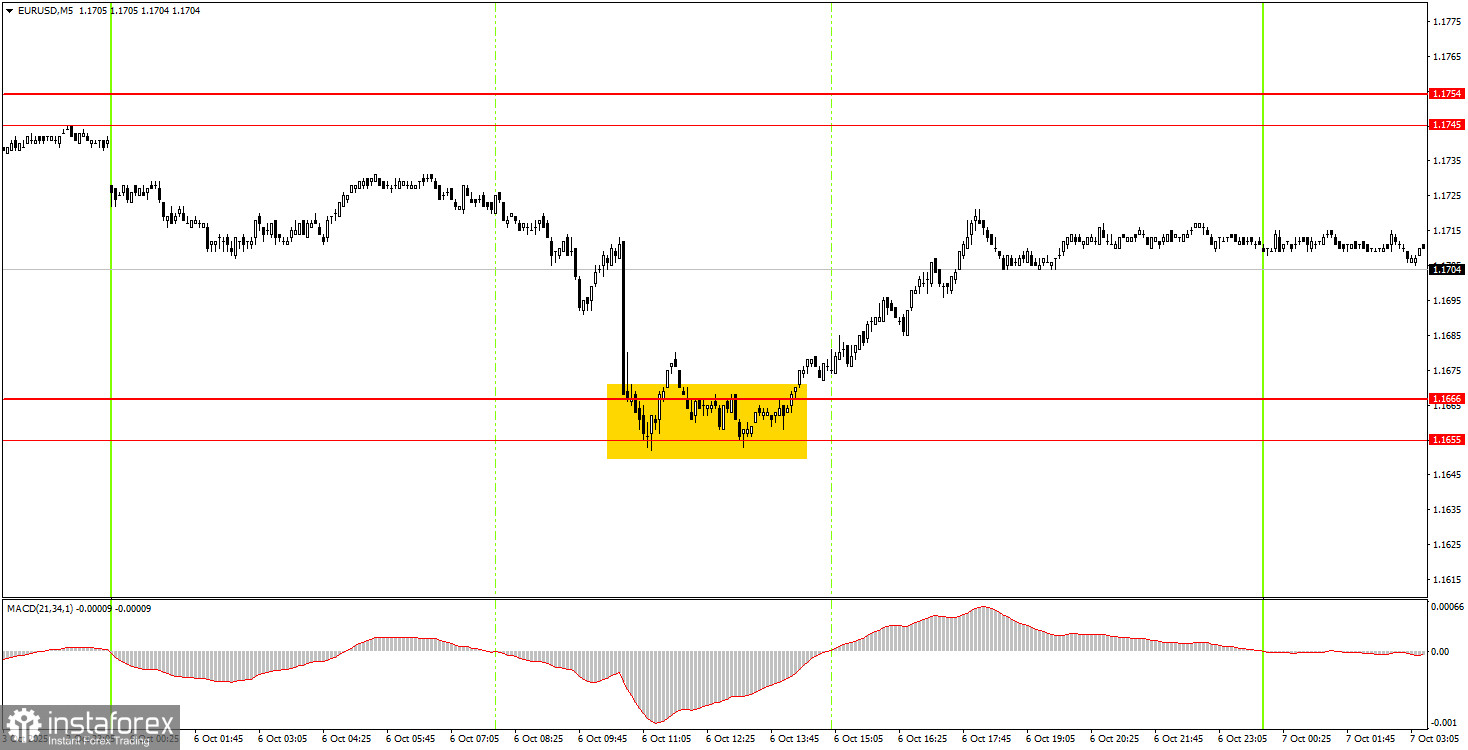
5-Minute EUR/USD Chart
On the 5-minute timeframe, a single excellent trading signal was formed on Monday. The price dropped to the 1.1655–1.1666 support zone, bounced off it, and then climbed 35 pips, with more gains possible today toward the 1.1745–1.1755 range. This provided beginners with a great opportunity to open long positions and take profit from a successful trade.
How to Trade on Tuesday
On the hourly chart, the EUR/USD pair has officially broken the trendline multiple times, meaning that the trend has formally shifted to bullish. The overall fundamental and macroeconomic backdrop for the US dollar remains negative, so we do not expect a strong rally from the dollar under any circumstances. As before, we believe the dollar can only expect short-term technical corrections, like the one currently occurring.
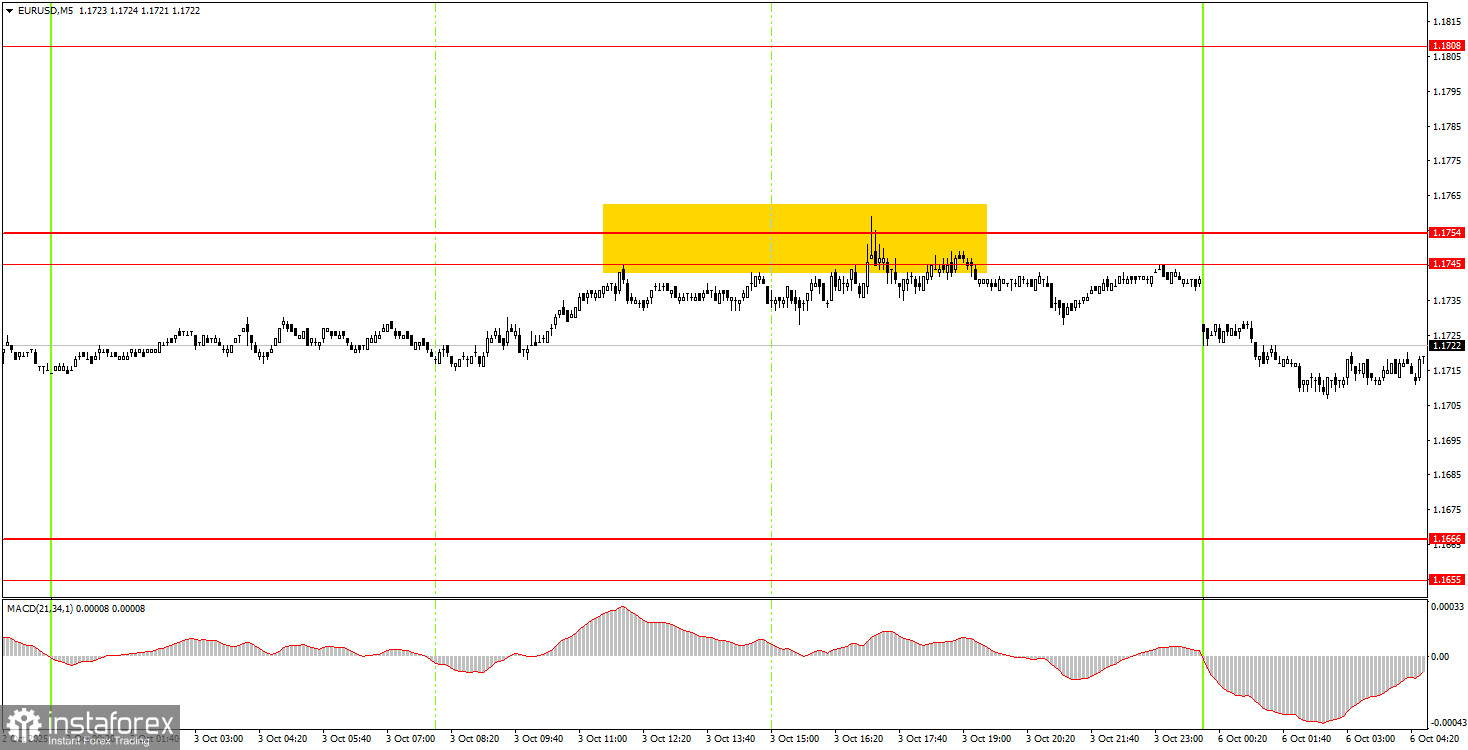
On Tuesday, EUR/USD is expected to trade between 1.1745–1.1754, or possibly return to 1.1655–1.1666 if it corrects lower. A bounce from the first area would be a signal to enter sell positions targeting 1.1666. A bounce from the second area would be a signal to go long with a target of 1.1745.
On the 5-minute timeframe, watch the following levels: 1.1354–1.1363, 1.1413, 1.1455–1.1474, 1.1527, 1.1571–1.1584, 1.1655–1.1666, 1.1745–1.1754, 1.1808, 1.1851, 1.1908, 1.1970–1.1988.
On Tuesday, European Central Bank President Christine Lagarde is scheduled to deliver another speech. She has been speaking frequently recently and is set to appear three times this week. In most cases, however, these speeches do not contain any new or significant information.
Core Trade System Rules:
- Signal strength is determined by the time it takes for the signal to form (a bounce or breakout). The shorter the time, the stronger the signal.
- If two or more false trades are made near a specific level, all future signals from that level should be ignored.
- During flat (sideways) markets, any pair may either produce many false signals or none at all. When early signs of a flat appear, it's best to pause trading.
- Trades should be opened between the start of the European session and the middle of the American session. After that, all trades should be closed manually.
- On the hourly timeframe, MACD indicator signals should only be followed if there is significant volatility and a confirmed trend (as indicated by a trendline or channel).
- If two levels are very close (within 5 to 20 pips), treat them as a support/resistance zone rather than individual levels.
- Once a position is 15 pips in profit, move the Stop Loss to breakeven.
What's on the Charts:
Support and resistance price levels – these are the target zones for entering buy/sell trades. Take-profit orders can be placed near these levels.
Red lines – trendlines or trend channels that show the current market direction and preferred trade direction.
MACD indicator (settings: 14, 22, 3) – the histogram and signal line serve as additional signal sources.
Important speeches and economic reports (always listed in the economic calendar) can significantly affect currency pair movements. During their release, it's advised to trade with extreme caution or exit the market to avoid sharp price reversals against the previous trend.
Final Note for Beginners:
New forex traders must remember that not every trade will be profitable. Developing a clear trading strategy and practicing sound money management are essential for achieving long-term success in trading.