GBP/USD Analysis – 5M Chart
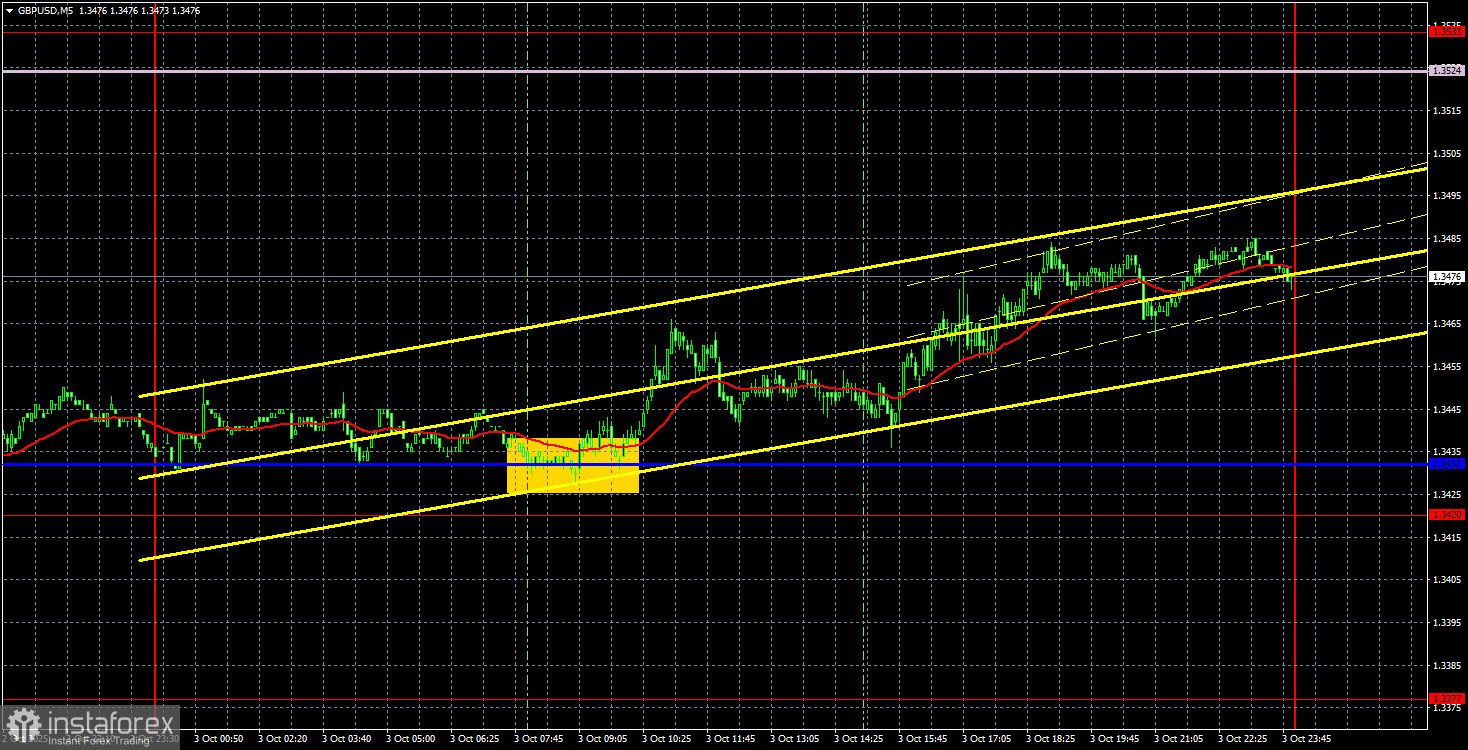
On Friday, the GBP/USD currency pair attempted to resume its upward movement in line with the new uptrend that formed after the last trendline break. However, as with the euro, most of the past week was spent in a flat phase. While less pronounced than in EUR/USD, the pound also failed to break below the critical line—or above the Senkou Span B line, for that matter. Thus, we're still in a flat market.
There were no significant events in the UK on Friday. The only noteworthy release was the U.S. ISM Services PMI, which was processed by the market weakly and unconvincingly. On Thursday, for reasons unclear, the pound plummeted despite having multiple fundamental reasons to fall earlier in the week. But for now, the market remains sideways, and there's nothing that can be done about it.
On the 5-minute chart, a fairly good buy signal was formed on Friday. At the start of the European trading session, the price rebounded from the critical line and then moved steadily upward for the remainder of the day. Traders who opened long positions on this signal could have closed with a manual profit of about 30 pips by the end of the session. While the profit wasn't huge, the day's overall volatility was low.
COT Report
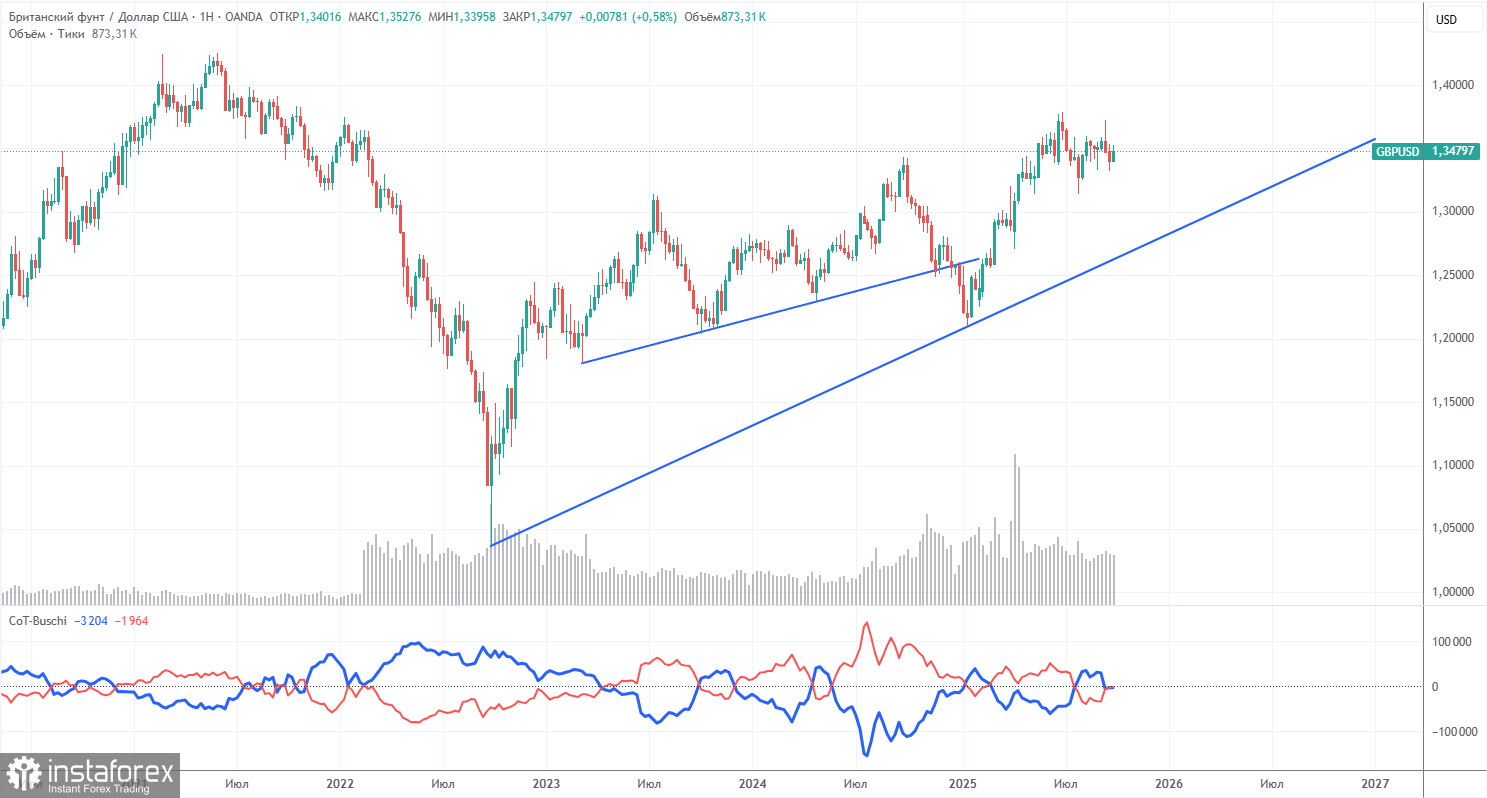
COT reports for the British pound indicate that commercial trader sentiment has been shifting constantly in recent years. The red and blue lines representing the net positions of commercial and non-commercial traders frequently cross and generally stay close to the zero mark. That is the case again now, suggesting that buy and sell positions are almost perfectly balanced.
The dollar continues to weaken mainly due to Donald Trump's policies, so demand for the pound by market makers is not particularly important at this point. The ongoing trade war is expected to continue in one form or another. The Federal Reserve is likely to continue cutting rates throughout the year, which reduces overall demand for the dollar.
According to the latest report, the "Non-commercial" group opened 3,700 new BUY contracts and closed 900 SELL contracts, increasing their net position by 4,600 contracts over the week.
In 2025, the pound experienced a significant rise, mainly due to U.S. political factors. When those factors dissipate, the dollar may recover—but no one knows when that will happen. The pace of net position changes in the pound is less important than the fact that the dollar's net position keeps falling—usually at a sharper rate.
GBP/USD Analysis – 1H Chart
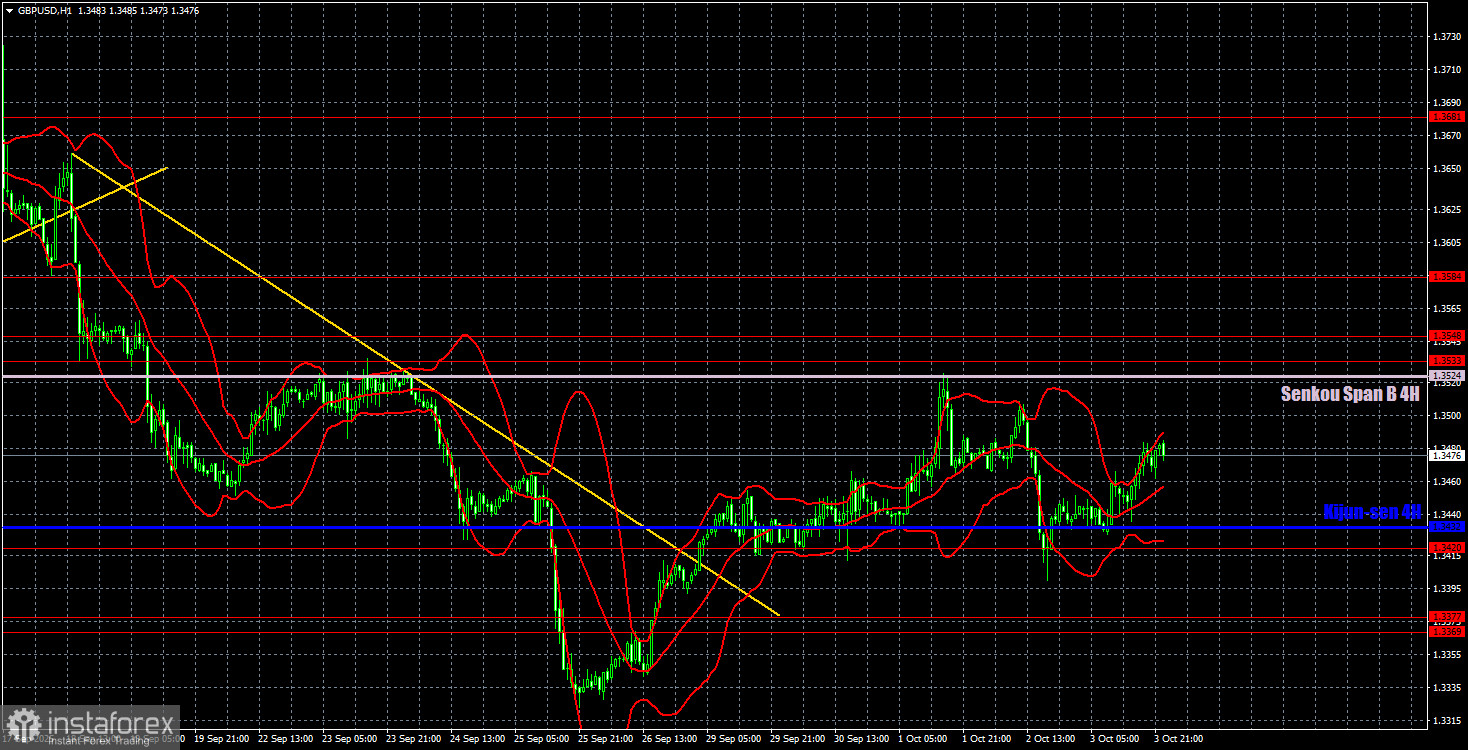
On the hourly chart, GBP/USD maintains a new uptrend. The trendline was broken to the upside, so traders have reason to expect the pair to continue rising. The dollar still lacks a fundamental bullish foundation, so we anticipate a continuation of the pair's 2025 uptrend in almost any scenario. Last week, the pair rebounded from the crucial Senkou Span B line, triggering a correction. However, the price did not break below the critical line.
Key Trading Levels for October 6: 1.3125, 1.3212, 1.3369–1.3377, 1.3420, 1.3533–1.3548, 1.3584, 1.3681, 1.3763, 1.3833, 1.3886. The Ichimoku indicator lines: Senkou Span B: 1.3524 and Kijun-sen: 1.3432. The stop loss should be set to breakeven once the price moves 20 pips in the intended direction. The Ichimoku lines may shift during the day and should be monitored when identifying signals.
On Monday, Bank of England Governor Andrew Bailey will deliver a speech. Although this is a potentially significant event, not all central bank speeches focus on monetary policy. No major events are scheduled in the U.S. for Monday.
Trading Recommendations:
Today, traders may expect the uptrend to continue. The price has bounced from the Kijun-sen line of the Ichimoku indicator, supporting the case for continued upward movement—at least to the Senkou Span B line. However, the macroeconomic backdrop today is neutral, and the pair remains range-bound overall.
Chart Clarifications:
- Support/Resistance levels – thick red lines, price may reverse around these. They are not trading signals.
- Kijun-sen & Senkou Span B – Ichimoku lines, transferred to the 1H chart from the 4H timeframe. Strong reference lines.
- High/Low levels – thin red lines marking previous reversal zones. They are used as trade signals.
- Yellow lines – trendlines, channels, and various technical patterns.
- Indicator 1 on COT charts – net position size of each trader category.