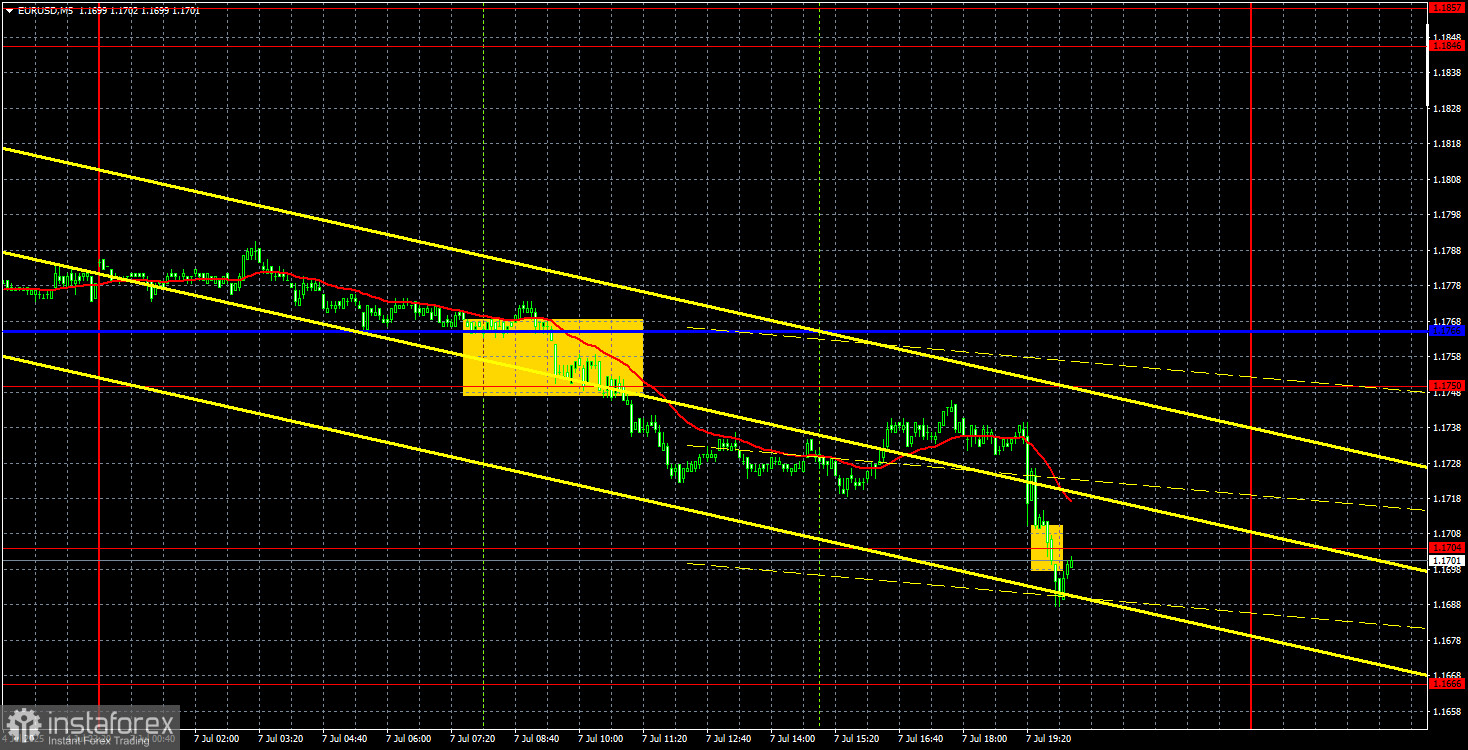
EUR/USD Analysis (5M)
The EUR/USD pair traded with a downward bias on Monday, even though there were no fundamental reasons supporting the dollar's strength. However, the dollar's rise was weak, which is especially evident in the hourly time frame. Recall that the pair had gained nearly 400 points in its latest bullish wave, but has only corrected about 120 points over the past week—even with strong U.S. macroeconomic data. So, although there were grounds for selling the pair, the market remains hesitant to engage with the U.S. currency.
There was no significant macroeconomic background from the U.S. on Monday, and the eurozone data was also very limited. Two European reports pointed more toward euro growth than weakness, but they failed to influence trader sentiment. Industrial production in Germany rose by 1.2% in May (vs. 0% forecast), though the previous month's figure was revised lower. Eurozone retail sales for May declined by 0.7%, which was generally in line with expectations.
These data had little chance of influencing the pair's movements from the outset. Last week, the market ignored even more impactful statistics. While the dollar is currently gaining ground, the pace of its appreciation suggests this movement may not last much longer.
Monday's volatility was around 70 points, and only one trading signal was formed. During the European session, the price broke below the 1.1750–1.1766 level, dropping an additional 15–20 points. It was very difficult to profit from short positions. The dollar is strengthening very slowly, with constant pullbacks, making shorts unappealing—especially considering the overall fundamental context.
COT Report
The latest COT (Commitments of Traders) report is dated June 24. The chart above clearly shows that net positions of non-commercial traders remained "bullish" for a long time. Bears briefly gained the upper hand at the end of 2024 but quickly lost it again. Since Donald Trump assumed office, the U.S. dollar has been in decline. While we can't say with certainty that the decline will continue, current global developments suggest that it might.
We still see no fundamental support for euro appreciation. However, one strong factor remains in place for a weaker dollar. The long-term downtrend continues—but how much does it matter what the price did over the last 16 years? Once Trump ends his trade wars, the dollar might rally. But will he ever end them? And when?
Currently, the red and blue lines have crossed again, signaling a return to a bullish trend. Over the last reporting week, the "Non-commercial" group increased long positions by 3,000 and reduced short positions by 6,600, resulting in a net increase of 9,600.
EUR/USD Analysis (1H)
On the hourly chart, EUR/USD has started a downward trend within a defined channel. Therefore, the dollar may continue appreciating in fits and starts for a few more days. But its fate this time also seems sealed. A flood of concerning information from the U.S. continues to push traders away from the dollar. Even strong U.S. macroeconomic data fails to attract buyers. Donald Trump's policies are gradually eroding the dollar's status as a "global reserve currency." This week, the global trade war could escalate further, and a full-blown conflict may erupt between Elon Musk and Donald Trump.
Trading Levels for July 8
Watch for the following key levels:1.1092, 1.1147, 1.1185, 1.1234, 1.1274, 1.1362, 1.1426, 1.1534, 1.1615, 1.1666, 1.1750, 1.1846–1.1857, as well as the Ichimoku indicator lines:
- Senkou Span B: 1.1642
- Kijun-sen: 1.1772
Note that Ichimoku lines can shift during the day, which should be considered when interpreting signals.Always use Stop Loss at breakeven once the price moves 15 pips in your favor. This helps protect against potential losses from false signals.
No Key Events Scheduled on Tuesday
There are no important economic releases or events scheduled for Tuesday in either the eurozone or the U.S. As such, volatility is expected to remain low, and trading is likely to continue within the downward channel.
Explanations to the illustrations:
- Support/Resistance Levels – Thick red lines; possible price reversal zones; not direct signal sources.
- Kijun-sen & Senkou Span B – Ichimoku lines from the 4H chart, shown on 1H; strong technical lines.
- Extreme Levels – Thin red lines from prior price bounces; used as trading signal sources.
- Yellow Lines – Trend lines, channels, or other technical patterns.
- COT Indicator 1 – Net position size for each trader group.