Tuesday's Trade Analysis:
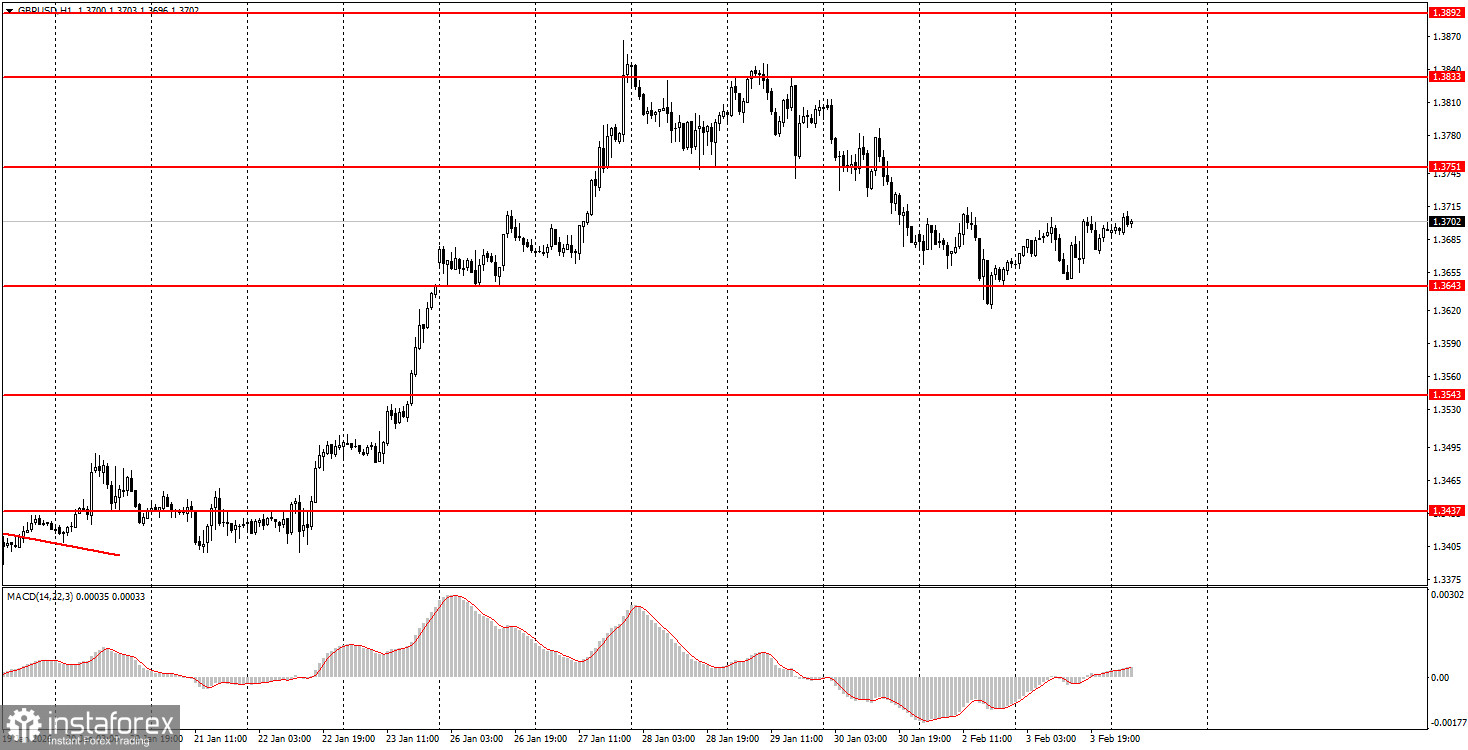
1H Chart of the GBP/USD Pair
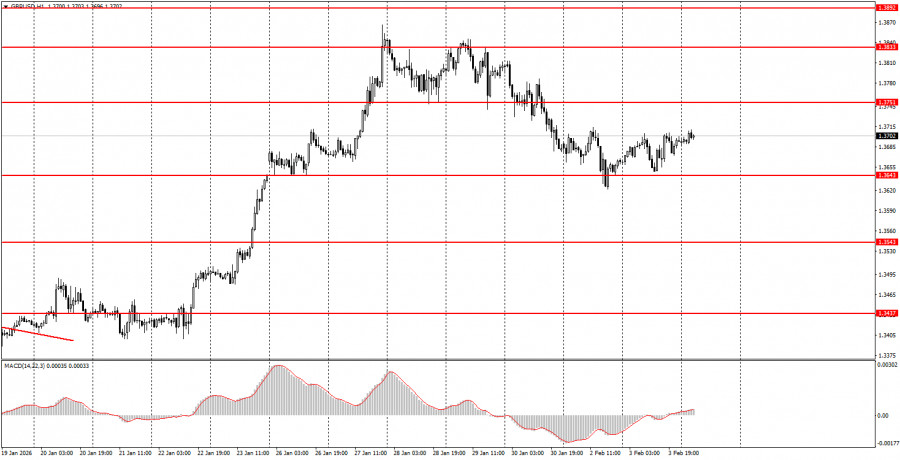
The GBP/USD pair continued to move higher on Tuesday. No significant reports were published on the day in either the US or the UK, although the JOLTS job openings report was initially scheduled for release yesterday. However, the "shutdown," which is said to end very quickly this time, is ongoing, so the JOLTs report was not published. This is not a major indicator and is released with a two-month delay, so the loss is minimal. However, the dollar could not sustain its strengthening due to the lack of events. It failed to continue because its strengthening again represents a simple technical correction. The GBP/USD pair surged upward by 500 pips within just a week; thus, a downward pullback was necessary. It can now be considered that the pullback has completed, meaning that the trend may resume. The remaining three days of the week will be quite busy. Today, important ADP and ISM reports will be released in the US; tomorrow, the Bank of England and ECB meetings will take place; and if the "shutdown" ends on Friday, the NonFarm Payrolls and unemployment rate will be announced.
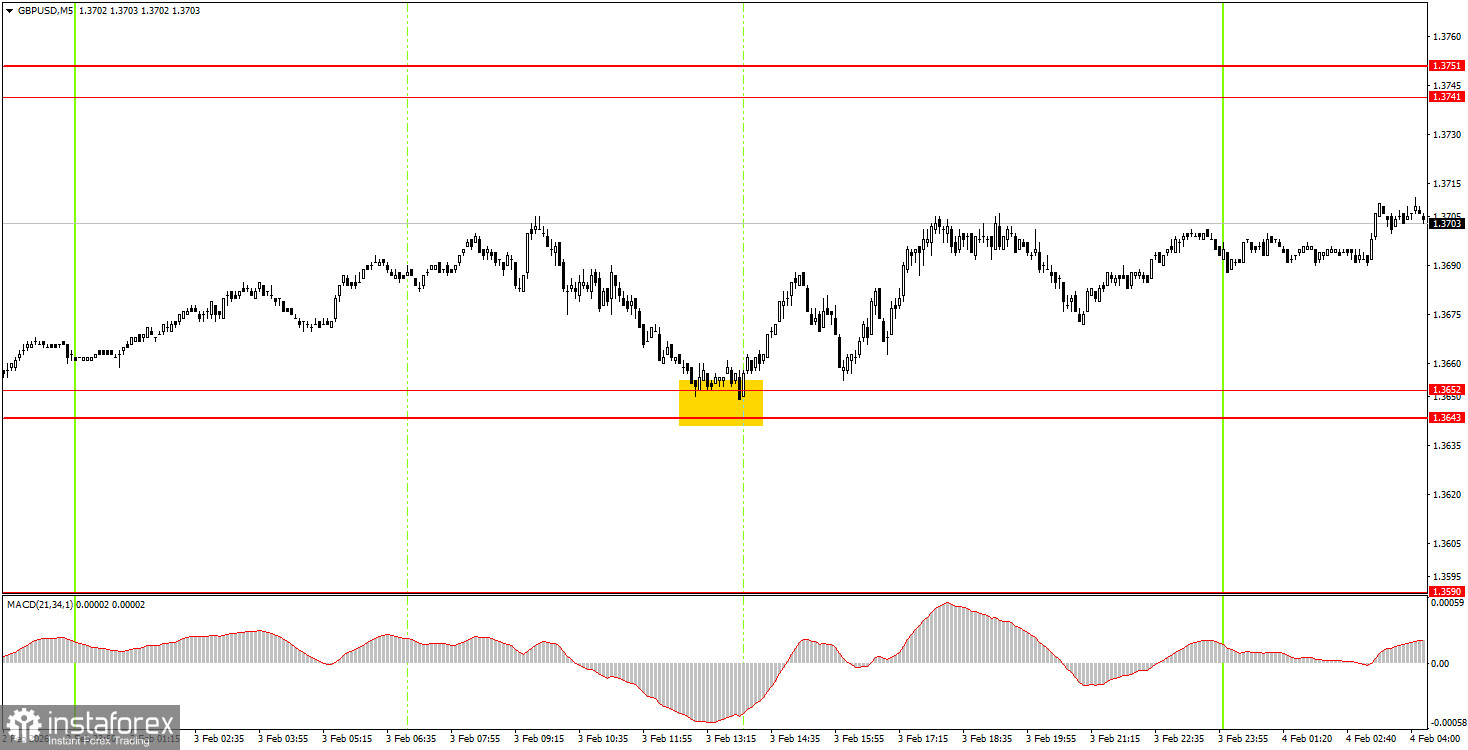
5M Chart of the GBP/USD Pair
On the 5-minute timeframe, only one trading signal was formed on Tuesday. At the very beginning of the American trading session, the price rebounded from the 1.3643-1.3652 area, allowing beginner traders to open long positions. By the end of the day, the British pound gained about 35 pips, which traders could have earned relatively easily.
How to Trade on Wednesday:
On the hourly timeframe, the GBP/USD pair continues to correct, but it seems that this correction will conclude shortly. No global factors are driving medium-term dollar growth, so we expect the global upward trend from 2025 to continue, which may push the pair to the 1.4000 mark soon. Donald Trump's policies remain unfavorable for the strengthening of the US currency, and the events currently unfolding in the US may exert additional pressure on the dollar.
On Wednesday, beginner traders may consider opening short positions if the pair rebounds from the 1.3741-1.3751 area, targeting 1.3643-1.3652. A rebound from the area of 1.3643-1.3652 allows for long positions with a target of 1.3741-1.3751, which could be carried over from Tuesday to Wednesday, secured with a Stop Loss.
On the 5-minute timeframe, trading can currently be conducted at the levels: 1.3319-1.3331, 1.3365, 1.3403-1.3407, 1.3437-1.3446, 1.3484-1.3489, 1.3529-1.3543, 1.3574-1.3590, 1.3643-1.3652, 1.3741-1.3751, 1.3814-1.3832, 1.3891-1.3912, 1.3975. There are no significant reports or events planned in the UK on Wednesday, while in the US, the ISM services activity index and the ADP labor market report will be released.
Main Rules of the Trading System:
- The strength of the signal is determined by the time it took to form the signal (rebound or breaking through the level). The shorter the time, the stronger the signal.
- If two or more trades were opened around a particular level based on false signals, all subsequent signals from that level should be ignored.
- In a flat market, any pair can generate numerous false signals or no signals at all. In any case, it is best to stop trading at the first signs of a flat.
- Trades are opened during the time period between the start of the European session and until the middle of the American session, after which all trades should be manually closed.
- On the hourly timeframe, signals from the MACD indicator should ideally be traded only when there is good volatility and a trend confirmed by a trend line or channel.
- If two levels are too close to each other (ranging from 5 to 20 pips), they should be considered as a support or resistance area.
- After moving 20 pips in the correct direction, it is advisable to set the Stop Loss to break-even.
What's on the Charts:
- Support and resistance levels are targets for opening buy or sell trades. Take Profit levels can be placed around them.
- Red lines indicate channels or trend lines that reflect the current trend and indicate the preferred direction for trading now.
- The MACD indicator (14,22,3) – the histogram and signal line – serves as a supplementary indicator that can also be used as a source of signals.
- Important speeches and reports (always found in the news calendar) can significantly influence the movement of the currency pair. Therefore, during their release, trading should be conducted with maximum caution, or it is advised to exit the market to avoid a sharp price reversal against the preceding movement.
- Beginners trading in the Forex market should remember that not every trade can be profitable. Developing a clear strategy and practicing sound money management are the keys to long-term trading success.