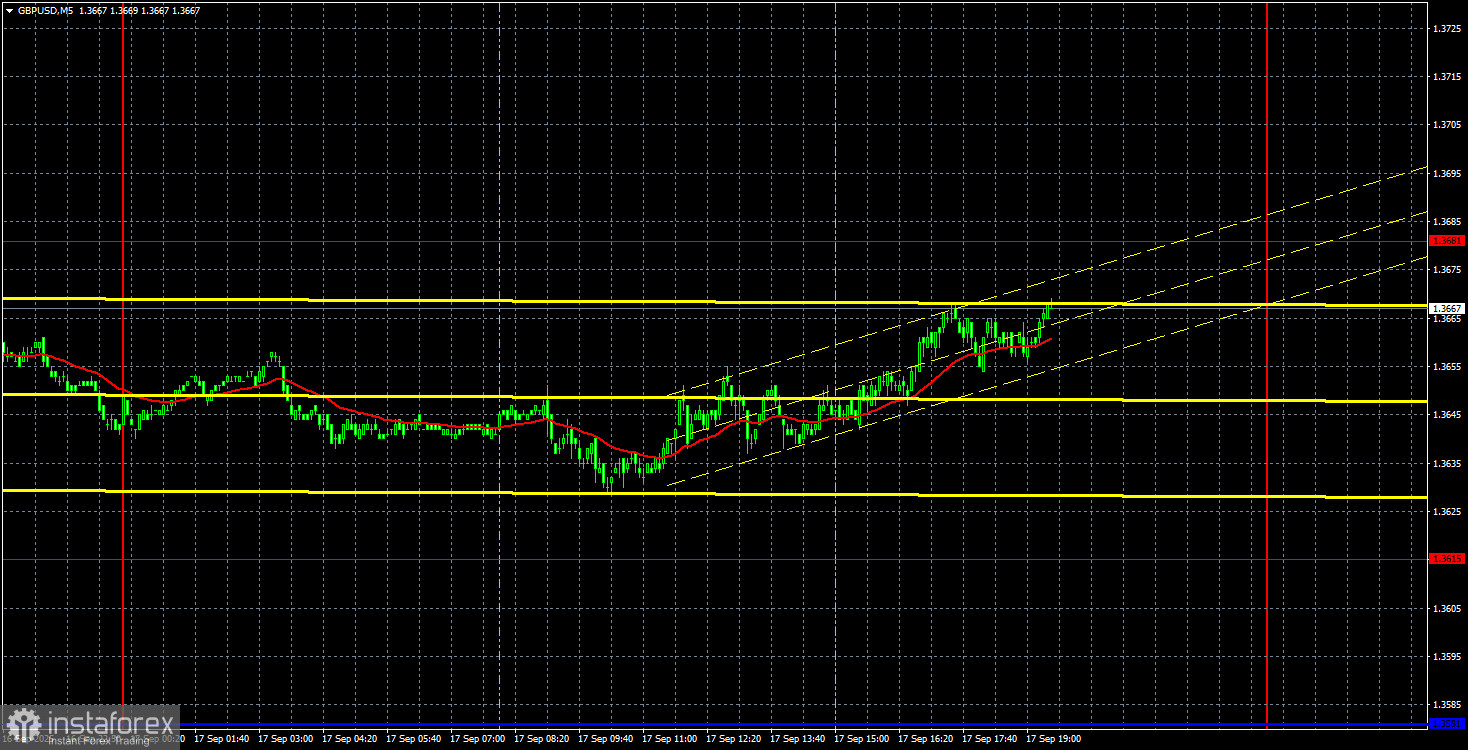
GBP/USD 5-Minute Analysis
On Wednesday, the GBP/USD currency pair also continued its upward movement until late in the evening. The pound sterling continues to rise steadily and confidently, with all necessary factors supporting it. U.K. data published this week did not spoil the picture for the pound. The British economy is far from being in its best shape, but that's not the main factor for traders right now. At most, domestic reports could have triggered a minor local pullback, while the pound is capable of growing even without supportive data from the U.K.
Yesterday, inflation was released and came exactly in line with forecasts. In August, headline CPI remained unchanged at 3.8%. Core inflation slowed slightly to 3.6%. Neither of these values suggests a more dovish tilt at today's Bank of England meeting. The British central bank will almost certainly leave the key rate unchanged, with the only intrigue being the voting split in the Monetary Policy Committee. The market expects no more than two members to support a rate cut under current conditions. If there are three or more, the pound could see a short-term drop.
On the 5-minute TF, not a single trading signal was formed yesterday, leaving traders with no reason to enter the market—especially ahead of the Fed meeting results.
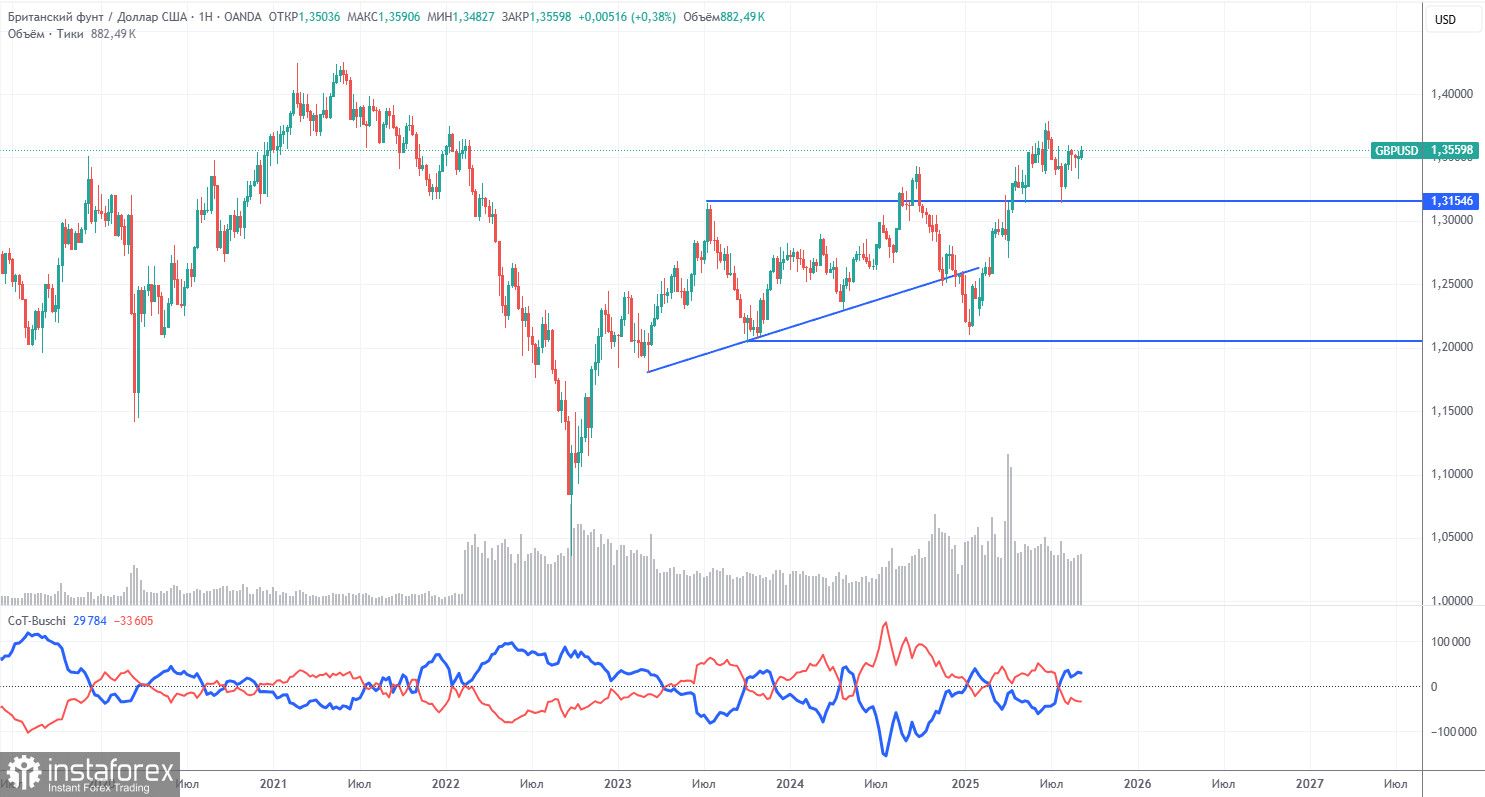
COT Report
COT reports on the British pound show that commercial traders' sentiment has been constantly changing in recent years. The red and blue lines (net positions of commercial and non-commercial traders) cross frequently and generally stay near zero. Right now, they're almost at the same level, which signals roughly equal amounts of long and short positions.
The dollar is still falling due to Trump's policies, so market maker demand for the pound is not so important right now. The trade war will continue, one way or another, for a long time. The Fed will lower rates at least once more within the next year, so dollar demand will keep falling. The latest COT report shows "Non-commercial" closed 1,200 BUY contracts and 700 SELL contracts. So, the net position decreased by 500 contracts during the reporting week.
The pound shot up in 2025, but the cause is clear—Donald Trump's policy. Once that factor is neutralized, the dollar could rally, but no one knows when that will happen. It doesn't really matter whether the net position in the pound rises or falls—the dollar's net position keeps shrinking, usually at a faster pace.
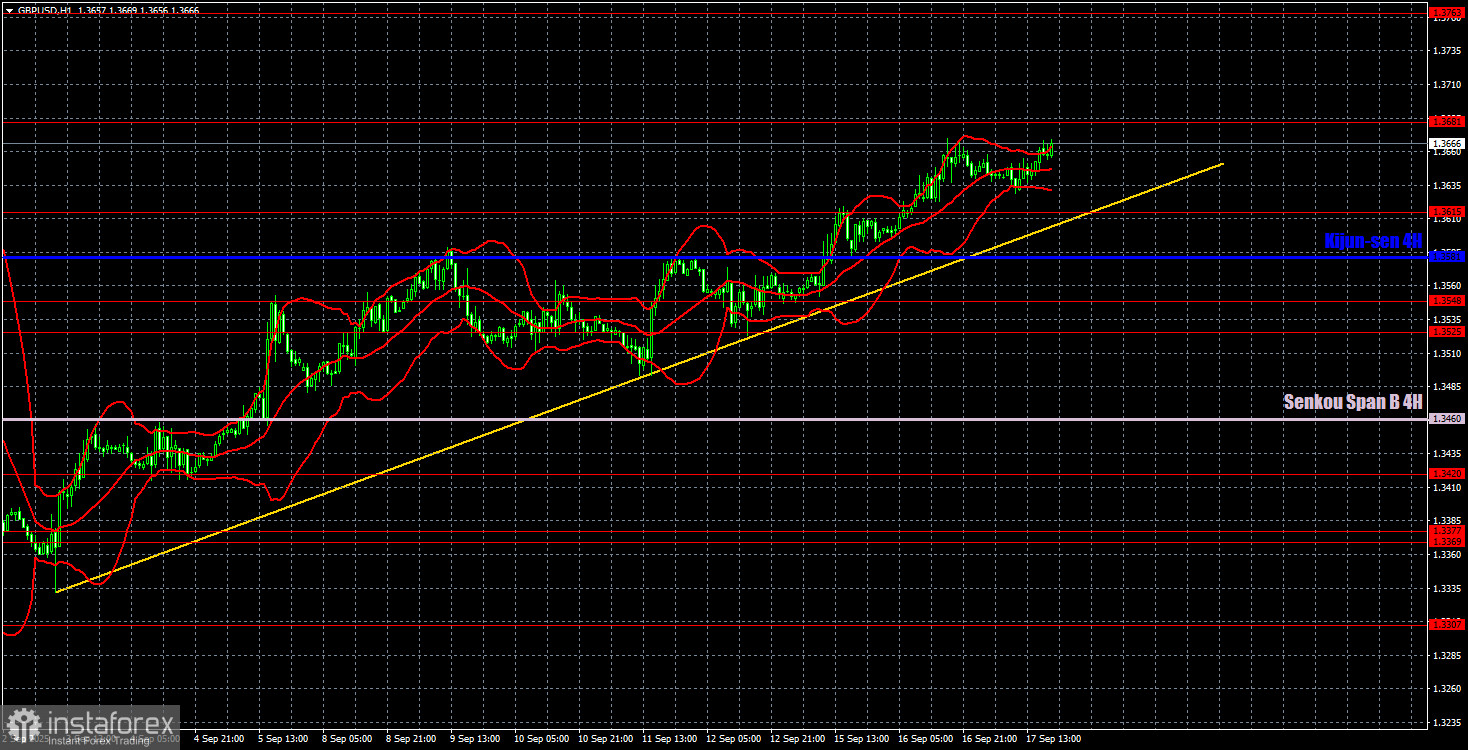
GBP/USD 1-Hour Analysis
On the hourly timeframe, GBP/USD is preparing for a new uptrend—and that's precisely what is happening. The fundamental and macroeconomic background remains weak for the dollar, so there's still no reason to expect medium-term growth. This week, a correction is theoretically possible, but technical signals are needed to confirm it, such as a break of the trendline.
For September 18, the important levels are: 1.3125, 1.3212, 1.3369–1.3377, 1.3420, 1.3525–1.3548, 1.3615, 1.3681, 1.3763, 1.3833, 1.3886. Senkou Span B (1.3460) and Kijun-sen (1.3581) lines may also generate signals. Stop Loss should be moved to breakeven once the price goes 20 pips in the right direction. Note that Ichimoku lines may shift during the day and should be factored into signal evaluation.
On Thursday, the BoE will announce its policy decision. Additionally, during the European session, traders will still be reacting to the Fed meeting and Powell's speech. Therefore, Thursday is likely to be highly volatile—unlike many recent sessions. In the U.S., the calendar contains nothing noteworthy.
Trading Recommendations
We expect that on Thursday, GBP/USD may continue or resume its rise, as nearly all factors point in this direction. However, fundamental events from Wednesday and Thursday may have a strong short-term impact on market sentiment, leading to complex, volatile movements with sharp reversals and price swings.
Illustration Explanations:
- Support and resistance price levels – thick red lines where movement may end. They are not trading signal sources.
- Kijun-sen and Senkou Span B lines—These are strong Ichimoku indicator lines transferred to the hourly timeframe from the 4-hour one.
- Extremum levels – thin red lines where the price has previously rebounded. These act as trading signal sources.
- Yellow lines – trend lines, trend channels, and other technical patterns.
- Indicator 1 on the COT charts – the size of the net position for each category of traders.