Wednesday Trade Analysis
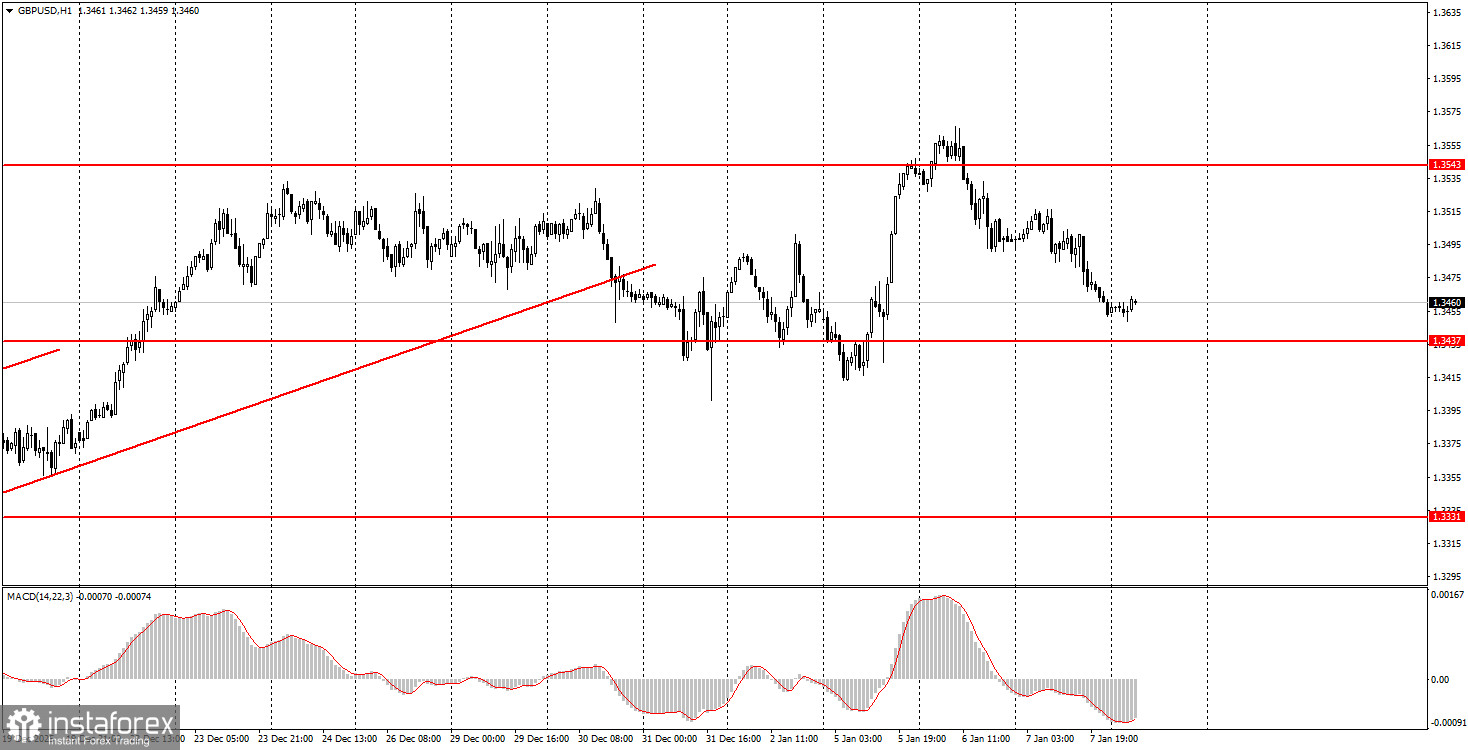
1H chart of the GBP/USD pair
The GBP/USD pair continued to trade lower throughout Wednesday amid a fairly contradictory macroeconomic backdrop. Let us recall that the euro showed virtually no price movement yesterday. As for the British pound, it had no strong reasons for either a decline or a rise. In the United Kingdom, there were no important events or data releases, while in the United States the published reports contradicted each other. While the ISM Services PMI showed a strong reading and eased pressure on the dollar after the weak ISM Manufacturing PMI, the ADP private employment report and the JOLTS job openings report came in below forecasts. We cannot call the dollar's rise illogical, since the ADP and JOLTS reports are less important than the Nonfarm Payrolls report and the unemployment rate. Therefore, most likely, the market has already shifted its focus to Friday's statistics, and the dollar strengthened on the back of the strong ISM report.
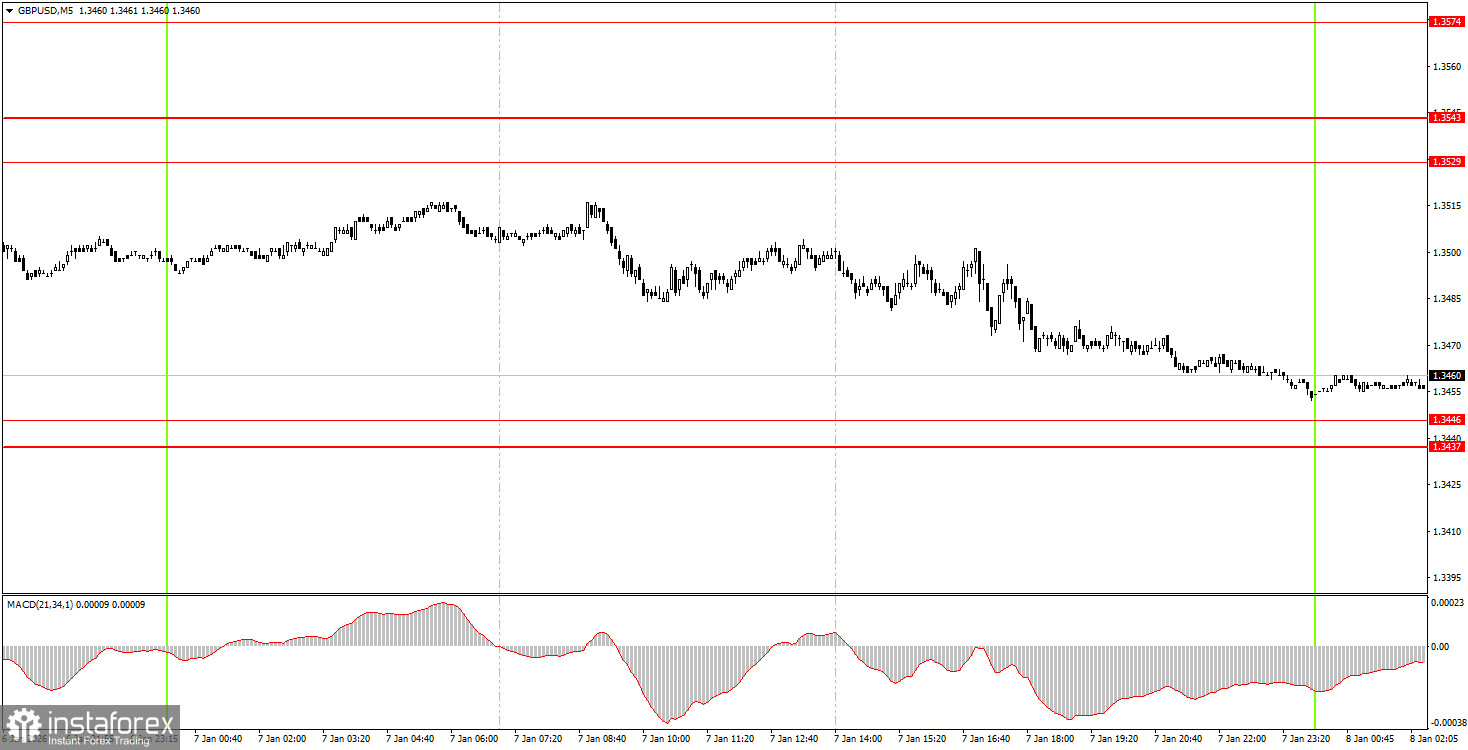
5M chart of the GBP/USD pair
On the 5-minute timeframe, no trading signals were formed on Wednesday either. However, on Tuesday evening the price rebounded from the 1.3529–1.3543 level, giving beginner traders an opportunity to open short positions. Throughout Wednesday, the pair continued its steady decline, and early Thursday the price worked off the 1.3437–1.3446 level with a deviation of just 2 points. Thus, the trade had to be kept open for almost two days, but it ultimately generated a profit.
How to Trade on Thursday
On the hourly timeframe, the GBP/USD pair has settled below the trendline; however, we see no clear downward trend at this time. There are no global reasons for medium-term U.S. dollar strength, so we expect movement only to the upside. Overall, we also expect a resumption of the global 2025 uptrend, which could bring the pair to the 1.4000 level within the next couple of months.
On Thursday, beginner traders may consider opening new positions. A rebound from the 1.3437–1.3446 level would allow new long positions to be opened with a target at 1.3529–1.3543. A firm break below the 1.3437–1.3446 level would make new sell orders relevant, with a target in the 1.3319–1.3331 level.
On the 5-minute timeframe, the following levels can currently be traded: 1.3043, 1.3096–1.3107, 1.3203–1.3212, 1.3259–1.3267, 1.3319–1.3331, 1.3437–1.3446, 1.3529–1.3543, 1.3574–1.3590, 1.3643–1.3652, 1.3682, 1.3763.
On Thursday, there are again no noteworthy events scheduled in the United Kingdom, while in the United States only initial jobless claims will be published, which are of limited interest to the market.
Basic Rules of the Trading System
- The strength of a signal is measured by the time required for the signal to form (a rebound from or a breakout of a level). The less time it takes, the stronger the signal.
- If two or more trades were opened near a certain level based on false signals, all subsequent signals from that level should be ignored.
- In a flat (range-bound) market, any pair may generate many false signals—or none at all. In any case, at the first signs of a flat market, it is better to stop trading.
- Trades should be opened during the time period from the beginning of the European session until the middle of the U.S. session, after which all trades should be closed manually.
- On the hourly timeframe, trades based on MACD signals should preferably be taken only when there is good volatility and a trend confirmed by a trendline or trend channel.
- If two levels are located too close to each other (from 5 to 20 points), they should be treated as a single support or resistance zone.
- After the price moves 20 points in the correct direction, the Stop Loss should be moved to breakeven.
What Is Shown on the Chart
- Price support and resistance levels are levels that serve as targets when opening buy or sell positions. Take Profit levels can be placed near them.
- Red lines represent channels or trendlines that display the current trend and indicate the preferred trading direction.
- The MACD indicator (14,22,3)—histogram and signal line—is an auxiliary indicator that can also be used as a source of signals.
Important speeches and reports (always listed in the economic calendar) can strongly affect currency pair movements. Therefore, during their release, it is recommended to trade with extreme caution or exit the market to avoid sharp price reversals against the prior move.
Beginner forex traders should remember that not every trade can be profitable. Developing a clear strategy and practicing sound money management are the keys to long-term success in trading.