The EUR/USD currency pair remained flat on Friday. The day saw both upward and downward movements. It is a notable achievement for the dollar that it has appreciated over the past five trading days rather than declined. While we constantly mention the irrational nature of recent movements—as the market has mostly been driven by the "Trump factor" in recent months—last week's U.S. macroeconomic data largely pointed to another wave of dollar depreciation, and Donald Trump remained silent on the trade war. Therefore, the U.S. dollar could easily have ended the week with significant losses, but that didn't happen, again underscoring the market's illogical behavior.
We won't focus too much on Friday's U.S. data as the market broadly ignores data releases. What was so positive on Friday? That April's Nonfarm Payrolls beat forecasts? So what if the March figure was revised downward? The unemployment rate didn't change—what's optimistic about that? Wages showed no significant changes. And there were no other major reports. Meanwhile, earlier in the week, the GDP report disappointed, pointing toward an approaching recession in the U.S. economy. If the U.S. labor market still holds up, that may be temporary.
That said, we'd note that the dollar could indeed rise in the near term. This could happen simply because it has been falling for several months. Of course, if Trump tomorrow revokes concessions and escalates the trade war again, the dollar will likely collapse. However, the market has already priced up in the current round of Trump's sanctions. Technical corrections are still a natural part of the market cycle. In short, the worst-case scenario has already played out. Therefore, the dollar may stop falling if no further trade war escalation occurs.
Currently, the Federal Reserve is the main threat to the U.S. currency. No one on the market seems to understand what the U.S. central bank will do next. If it rushes to rescue the economy, rate cuts are a bearish signal for the dollar. But if it aims to maintain inflation at a steady 2%, then rates likely won't be cut anytime soon, and the market won't have a new reason to sell the dollar.
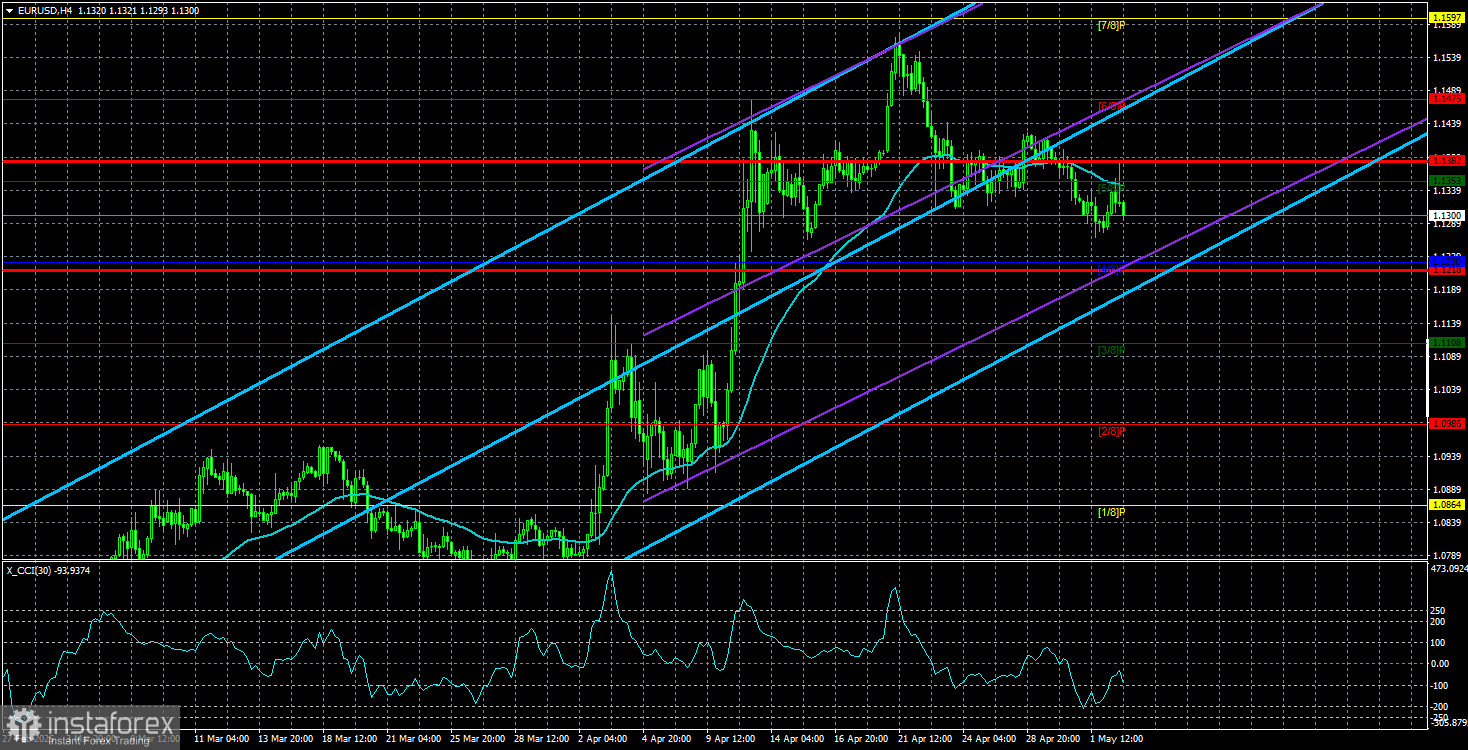
We expect a correction for now, but the hourly timeframe clearly shows that the pair has been trading within a sideways channel for over three weeks. The 1.1274 level, which serves as the lower boundary of this channel, still hasn't been broken. Flat conditions will persist as long as the price remains in the channel.
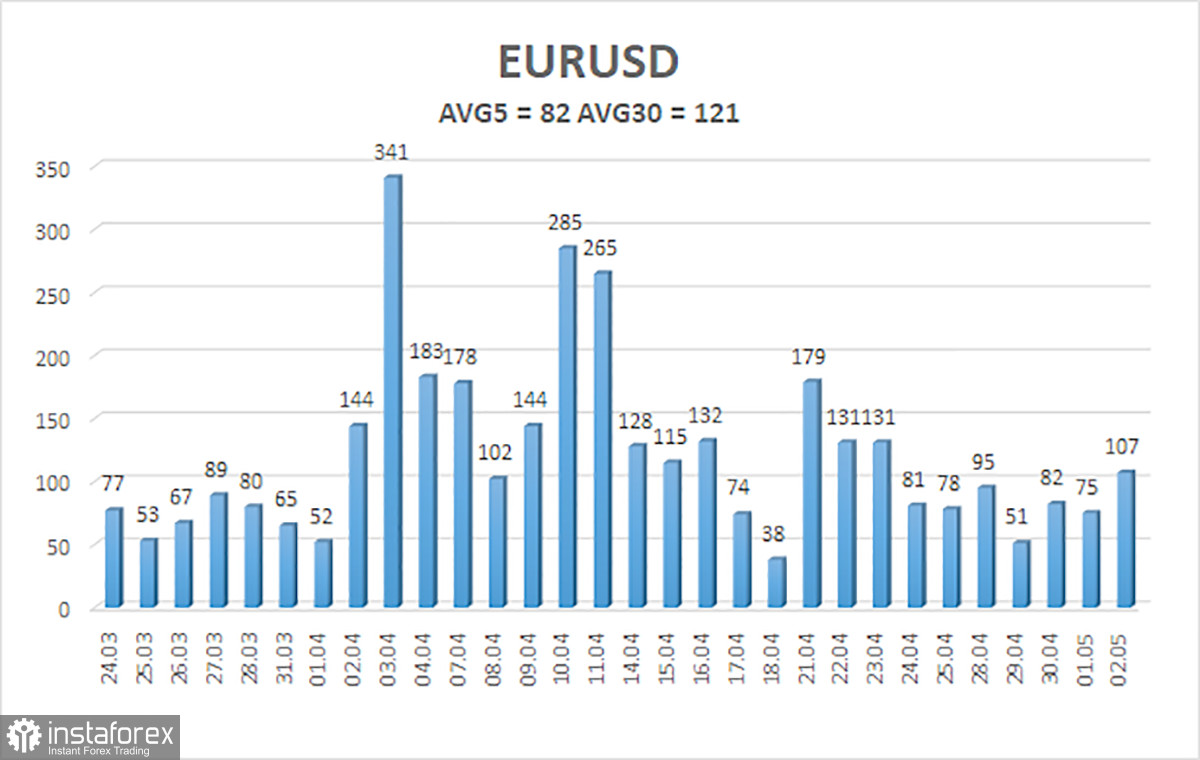
The EUR/USD pair's average volatility over the last five trading days as of May 5 is 82 pips, which is considered "average." On Monday, we expect the pair to move between 1.1218 and 1.1382. The long-term regression channel is directed upward, indicating a short-term uptrend. The CCI indicator has entered the overbought area three times recently, resulting in only a minor correction.
Nearest Support Levels:
S1 – 1.1230
S2 – 1.1108
S3 – 1.0986
Nearest Resistance Levels:
R1 – 1.1353
R2 – 1.1475
R3 – 1.1597
Trading Recommendations:
EUR/USD has begun a new round of downward correction within a broader uptrend. For months now, we've maintained that we expect the euro to fall in the medium term, and that hasn't changed. The dollar still lacks reasons for a medium-term rally—except for Donald Trump. However, that one reason alone has continued to drag the dollar lower, and the market is ignoring all other factors for now. If you trade based purely on technicals or Trump headlines, then long positions remain relevant as long as the price is above the moving average, with a target at 1.1475. If the price is below the moving average, short positions are appropriate, with targets at 1.1230 and 1.1218. It's hard to believe in a strong dollar rally, but a dollar rebound is still possible.
Explanation of Illustrations:
Linear Regression Channels help determine the current trend. If both channels are aligned, it indicates a strong trend.
Moving Average Line (settings: 20,0, smoothed) defines the short-term trend and guides the trading direction.
Murray Levels act as target levels for movements and corrections.
Volatility Levels (red lines) represent the likely price range for the pair over the next 24 hours based on current volatility readings.
CCI Indicator: If it enters the oversold region (below -250) or overbought region (above +250), it signals an impending trend reversal in the opposite direction.