Monday's Trade Breakdown
1-Hour GBP/USD Chart
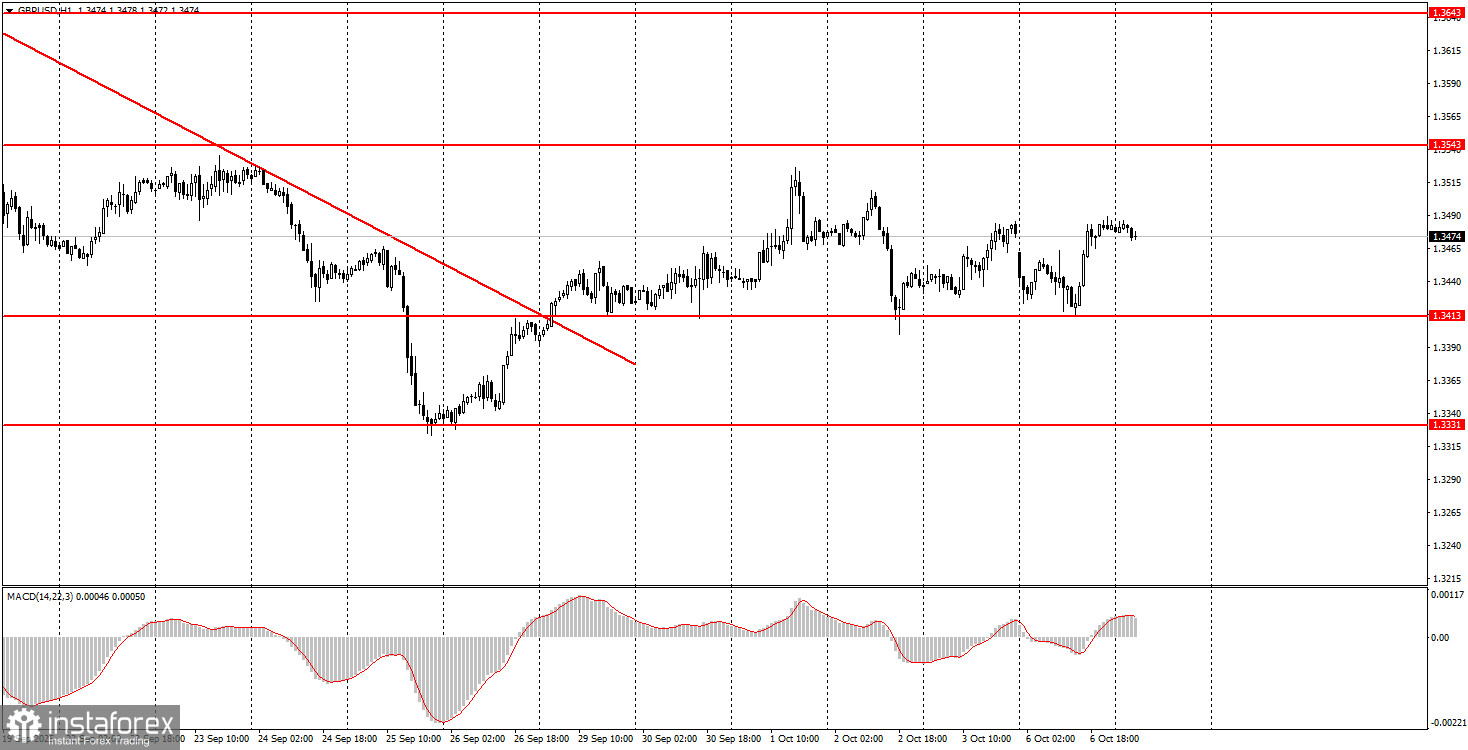
On Monday, the GBP/USD currency pair moved both upward and downward throughout the day. Traders failed for the third consecutive time to break above the 1.3413 level, and overall, the pound's movements increasingly resemble a flat market.
For context, the EUR/USD isn't currently in a flat phase, but its movement is erratic due to frequent corrections and pullbacks, along with a lack of growth despite the end of the previous downtrend.
The British pound lacked any major news on Monday. Bank of England Governor Andrew Bailey did speak, but he didn't provide the market with any significantly new or impactful insights. In the morning, the pound declined under the indirect influence of France's political crisis—not due to the crisis itself, but due to the euro reacting negatively and pulling the pound with it.
In the second half of the day, the pound recovered, since neither the U.S. dollar nor the British pound had compelling reasons to strengthen or weaken. As a reminder, current fundamental and macroeconomic conditions generally support any currency over the U.S. dollar.
5-Minute GBP/USD Chart
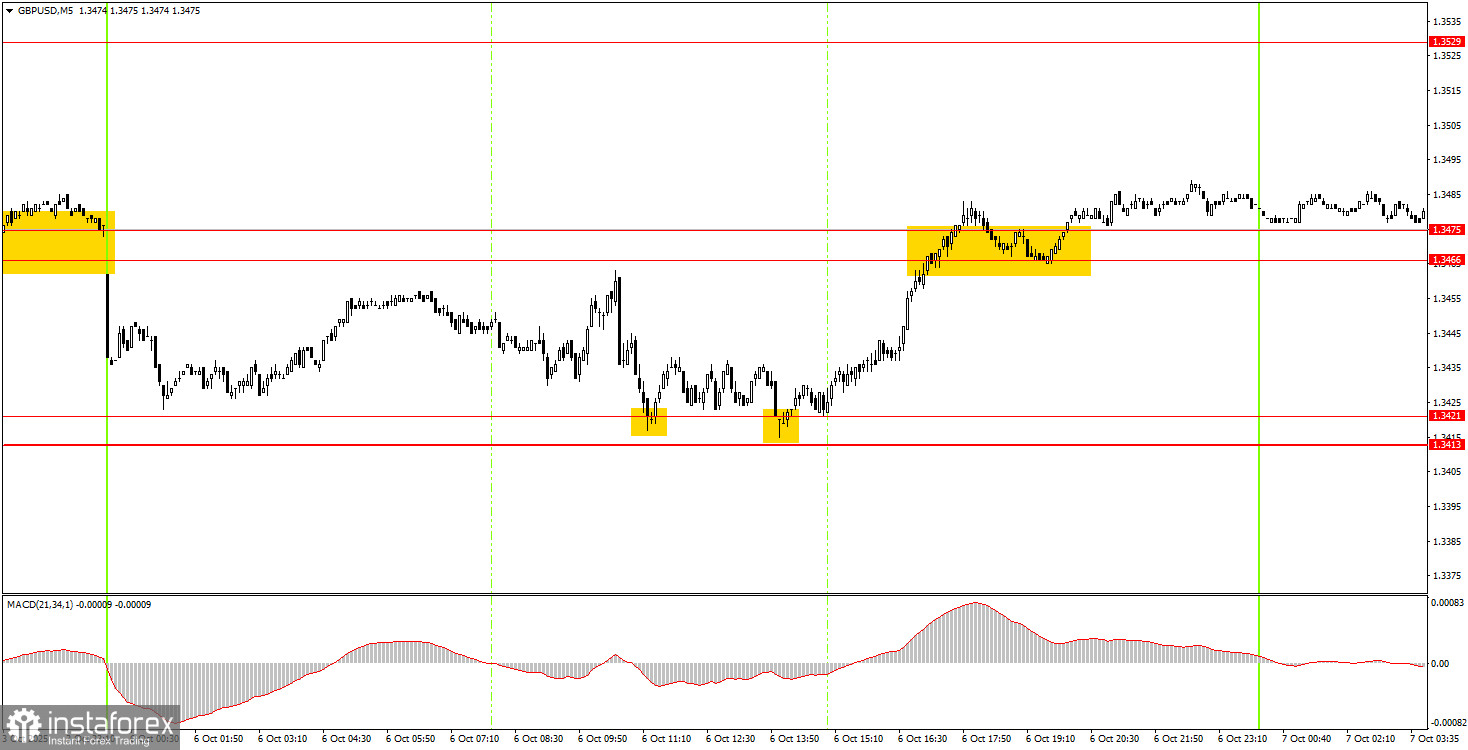
On the 5-minute timeframe, three trading signals were formed on Monday. During the European trading session, the price bounced twice from the 1.3413–1.3421 zone, providing solid justification for opening long positions. Within just a few hours, the price reached and eventually broke through the 1.3466–1.3475 area. As of Tuesday morning, the price remains above this zone, so long positions could have already been closed in profit, or left open with a target of 1.3529.
How to Trade on Tuesday
On the hourly chart, the GBP/USD pair has completed the formation of its previous downtrend. As previously noted, there are currently no grounds for a sustainable dollar rally, so we expect the pair to continue its upward movement over the medium term. However, for now, the market is in a state of inertia or stagnation—almost frozen—with little meaningful price action. Trading can still be done using technical analysis on lower timeframes, but volatility remains low.
On Tuesday, the GBP/USD pair may continue rising from the 1.3466–1.3475 area. If the price bounces from this zone, long positions may be opened with a target of 1.3529. A breakout below this zone would suggest a potential drop toward the 1.3413–1.3421 range.
On the 5-minute timeframe, the key trading levels for Tuesday are: 1.3102–1.3107, 1.3203–1.3211, 1.3259, 1.3329–1.3331, 1.3413–1.3421, 1.3466, 1.3475, 1.3529–1.3543, 1.3574–1.3590, 1.3643–1.3652, 1.3682, 1.3763.
No important economic events or reports are scheduled in either the U.S. or the U.K. for Tuesday. As a result, traders will have little to react to during the session.
Core Trade System Rules:
- Signal strength is determined by the time it takes for the signal to form (a bounce or breakout). The shorter the time, the stronger the signal.
- If two or more false trades are made near a specific level, all future signals from that level should be ignored.
- During flat (sideways) markets, any pair may either produce many false signals or none at all. When early signs of a flat appear, it's best to pause trading.
- Trades should be opened between the start of the European session and the middle of the American session. After that, all trades should be closed manually.
- On the hourly timeframe, MACD indicator signals should only be followed if there is significant volatility and a confirmed trend (as indicated by a trendline or channel).
- If two levels are very close (within 5 to 20 pips), treat them as a support/resistance zone rather than individual levels.
- Once a position is 20 pips in profit, move the Stop Loss to breakeven.
What's on the Charts:
Support and resistance price levels – these are the target zones for entering buy/sell trades. Take-profit orders can be placed near these levels.
Red lines – trendlines or trend channels that show the current market direction and preferred trade direction.
MACD indicator (settings: 14, 22, 3) – the histogram and signal line serve as additional signal sources.
Important speeches and economic reports (always listed in the economic calendar) can significantly affect currency pair movements. During their release, it's advised to trade with extreme caution or exit the market to avoid sharp price reversals against the previous trend.
Final Note for Beginners:
New forex traders must remember that not every trade will be profitable. Developing a clear trading strategy and practicing sound money management are essential for achieving long-term success in trading.